


Applies to
ApexSQL Monitor
Summary
ApexSQL Monitor incorporates system, SQL Server and database performance metrics, along with specific sets of metrics related to wait statistics, indexes and AlwaysOn SQL Server configuration. Also, it allows user to add custom metrics, as well.
Description
This article provides a reference list with information on which system, SQL Server and database metrics can be included in custom report items (information provided in the Custom report item column). Additionally, several metrics are linked to articles where they are mentioned.
| Type | Name | Custom report item |
|
Available megabytes of memory (MB) Average bytes per read (bytes) Average bytes per write (bytes) Average disk queue length Average read time (s) Average write time (s) Current disk queue length Disk reads per second (MB) Disk writes per second (MB) Free space (%) Network utilization (bytes/s) Pages input per second Pages per second Paging file usage (%) Processor queue length Utilization of processor time (%) |
|
|
| System availability |
|
|
|
|
Batch requests per second Buffer cache hit ratio (%) Compilations per second Deadlocks per second Forwarded records per second Free list stalls per second Full scans per second Index searches per second Lazy writes per second Lock requests per second Longest running transaction (s) Memory grants pending Page life expectancy (s) Page reads per second Page splits per second Page writes per second Re-compilations per second SQL Server agent status SQL Server failover Target server memory (KB) Total server memory (KB) User connections |
|
| SQL Server availability |
|
|
|
|
Data file size (MB) Log file size (MB) Log growths Total database size (MB) Transactions per second |
|
| Status changed |
|
|
|
|
Wait stats (ms) |
|
|
|
Average fragmentation (%) Fill factor (%) Row count System scans Unused space (MB) Unused space in buffer (MB) Used space (MB) Used space in buffer (MB) User lookups User scans User seeks User updates |
|
|
AlwaysOn Failover Availability replica connected state Availability replica operational state Availability replica recovery health Availability replica role Availability replica synchronization health Bytes received from replica per second Bytes sent to replica per second Bytes sent to transport per second Receives from replica per second Sends to replica per second Sends to transport per second |
|
|
|
|
Availability database log send queue (KB) Availability database recovery queue (KB) Availability database state Availability database synchronization health Availability database synchronization state |
|
FAQs
Q: Where can I find detailed information on specific metrics?
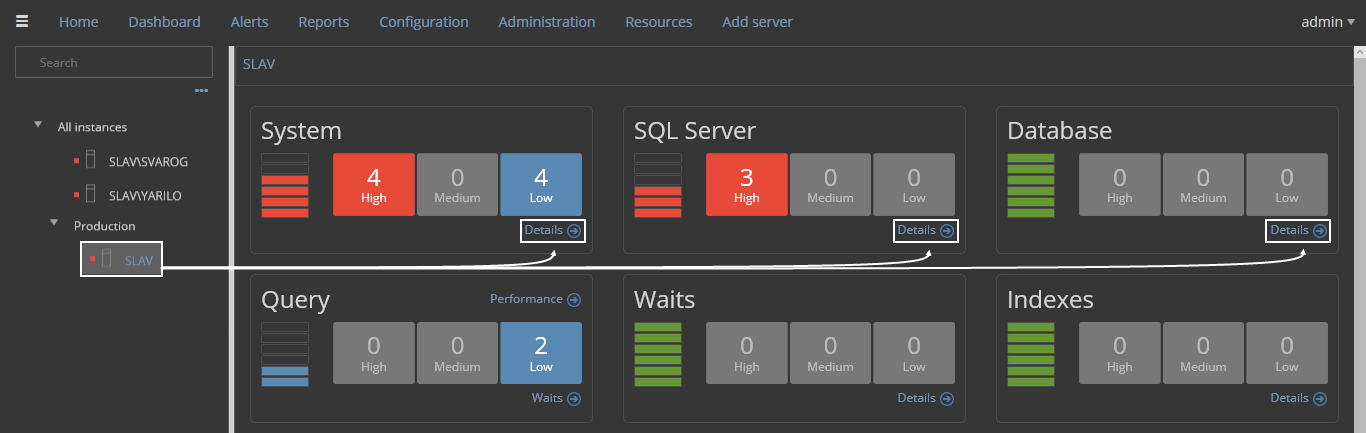
A: Detailed information on each of system, SQL Server and database metric can be retrieved by their respective metric helpers, by clicking links in charts’ headers. To do that, choose a desired SQL Server instance and choose System, SQL Server or Database panel (see the picture below):
After choosing a panel (we will show charts in System panel), click on a chart’s header link, and pop-up dialog (the Metric helper) will appear:
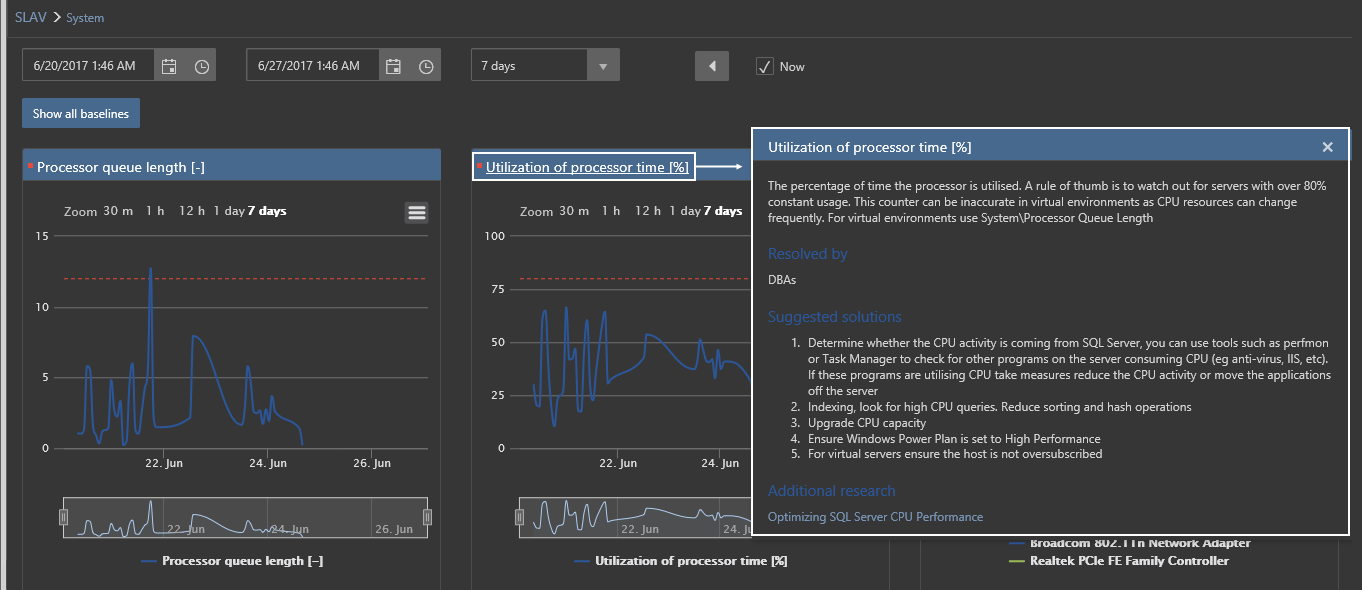
Within these pop-ups, user can find detailed information on the metrics themselves, suggested solutions and starting point for the additional research.
Q: Are metrics configurable?
A: Yes, metrics are fully configurable. Users can enable/disable them, and set additional options like alerting, alert thresholds and other.


