Applies to
ApexSQL Monitor
Summary
This article describes how to utilize the Custom reports feature in ApexSQL Monitor.
Description
As an alternative reporting method to the already built-in ApexSQL Monitor reports, custom reports allow users to specifically choose which and how many systems, SQL Server or database metrics will be included in a report.
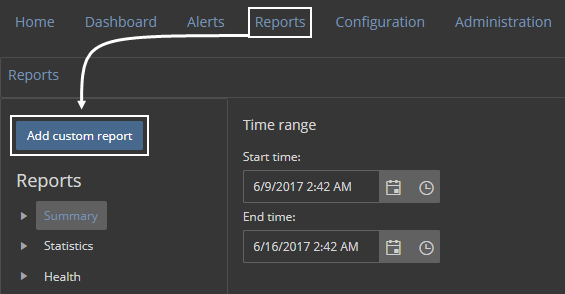
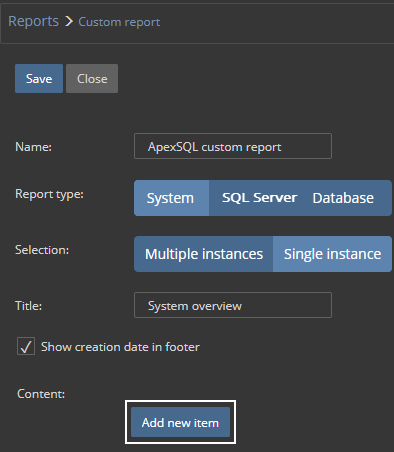
To create a custom report, go to the Reports subsystem, and click the Add custom report button:
Setting the following characteristics are the first step in defining a custom report profile:
- Custom report name – for this example, we will use the name “ApexSQL custom report”, and by this name, future custom report profile will be present in the Reports sidebar after saving
- The report types: System (for system metrics), SQL Server and Database
- The selection parameter defines if the custom report includes multiple instances or a single instance
- The title of a custom report (in this case, System overview)
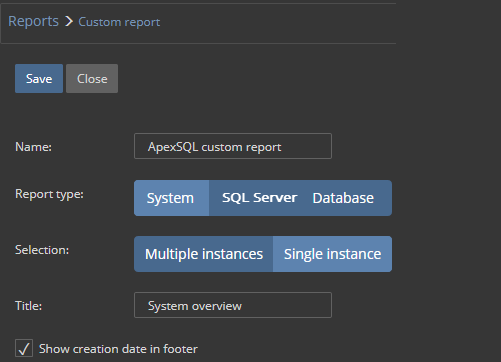
Additionally, a timestamp (or creation date) can be included in the footer of a generated custom report.
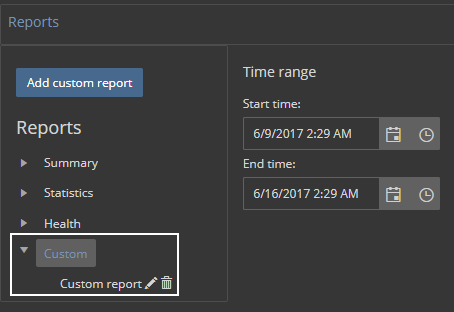
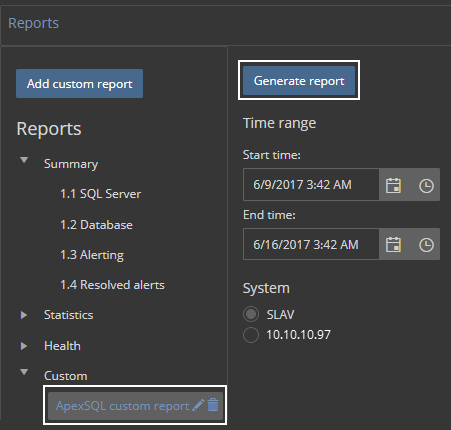
After saving the first custom report profile, the custom reports group will appear in the sidebar, along with created custom reports profile(s):
|
Quick tip: Custom report profiles can be edited by clicking the pencil icon beside the title (as in the screenshot above) |
The second step in creating a custom report is to add desired content / report items. To do that, edit the previously created custom report profile, and click on the Add new item button beneath the mentioned parameters:
For illustrative purposes, we will add all three report items types (chart, bar and pie separately, with Processor queue length, Free space and System availability metrics), which all correspond to the System report type, and the report will be generated for a single instance.
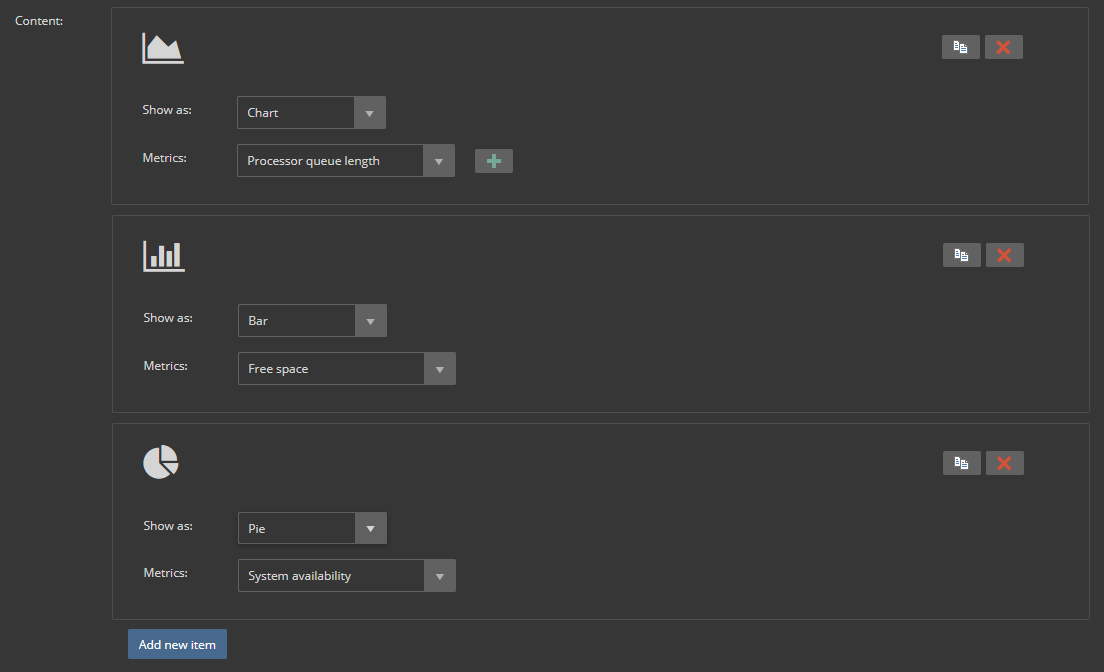
For the complete list of metrics (which can be embedded in the each of the report item), refer to this article.
|
Quick tip: The metrics list is the same for chart and bar report items, regardless the chosen custom report type. |
After saving the changes, choose the custom report profile and set a time range. Since this example is a system report for a single instance, choose a desired machine and click the Generate report button:
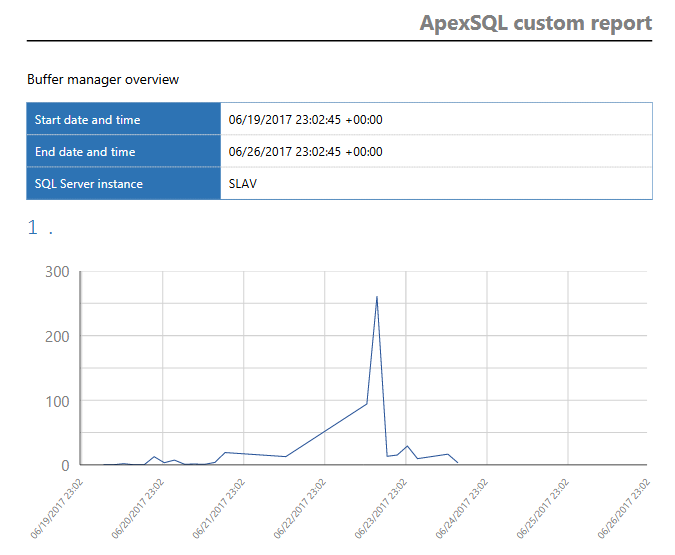
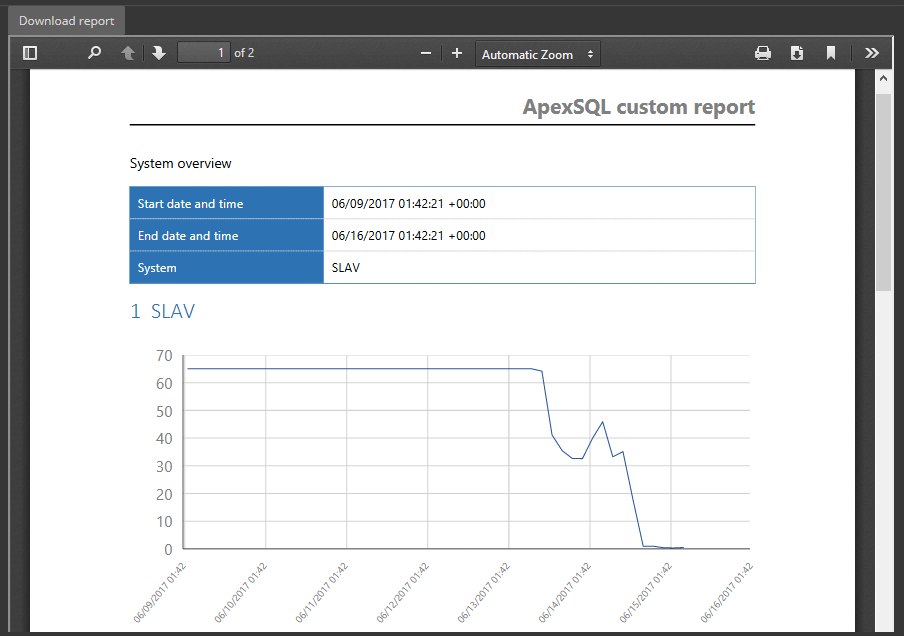
After being generated, a custom report will appear like this:
FAQs
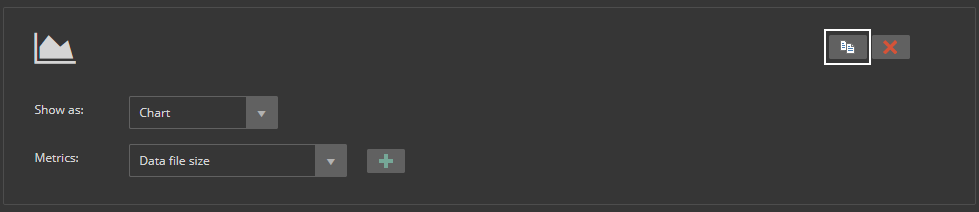
Q: Can I clone report items, instead of creating a new one from scratch?
A: Yes, report items can be directly cloned simply by clicking a Copy button within the report item panel, and changed accordingly (marked below):
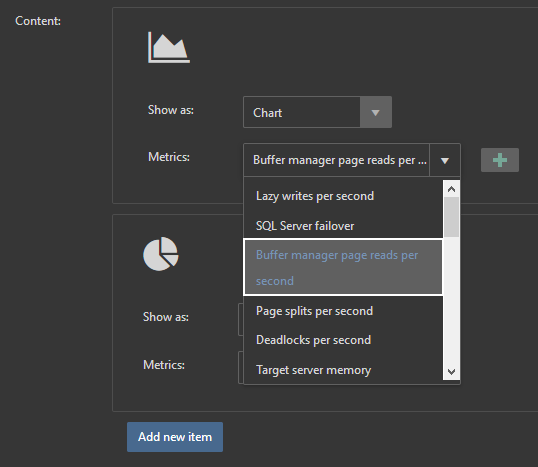
Q: Can I include custom metrics in a custom report?
A: Yes, all types of custom metrics can be included in a custom report in form of chart and/or bar. To be sure that custom metric will be successfully added within a custom report item, it must be present in configuration of a specified SQL Server instance for which a custom report is generated, especially if a custom report is set to generate for a single instance. For illustrative purpose, the custom metric (Buffer manager page reads per second) will be embedded as the chart:
and shown within the SQL Server custom report: