


In the Part 1 of the article, functions and examples of reporting on performance metrics and status metrics were presented. In this article, the functions and examples of the reports for indexes, database status and alerts will be shown.
This article also relies on the Helper functions that can be found in the KB ApexSQL Monitor ad hoc reporting Helper functions inventory, descriptions and examples and on the reporting functions that can be found in the KB ApexSQL Monitor ad hoc reporting functions inventory, descriptions and examples
Make sure that all the functions are created and exists in the ApexSQL Monitor repository database
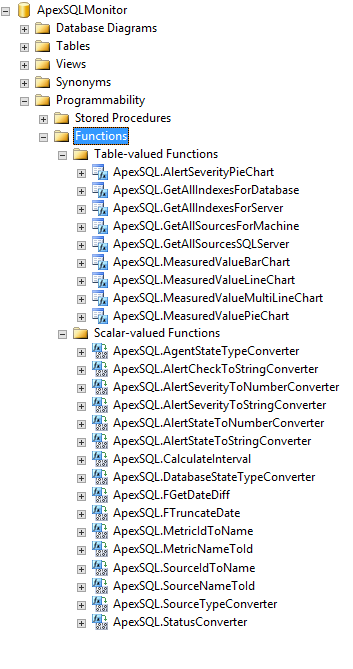
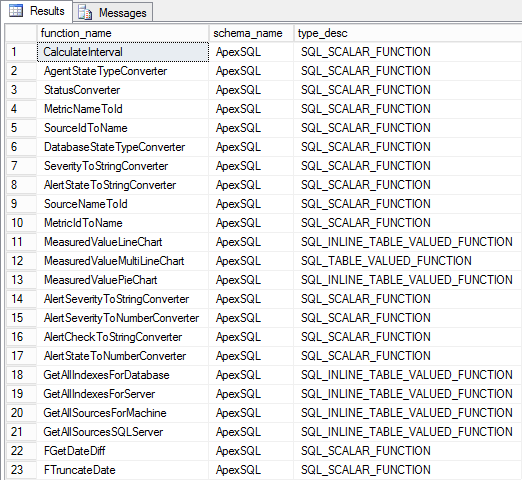
To check whether all the functions are created, the below script can be used to list all the functions with ApexSQL schema in the ApexSQL Monitor repository database
USE ApexSQLMonitor
GO

SELECT name AS function_name
,SCHEMA_NAME(schema_id) AS schema_name
,type_desc
FROM sys.objects
WHERE type_desc LIKE '%FUNCTION%';
GO
After all the functions listed are created in the central repository database, the user can start using the below scripts (or write their own) for creating custom reports for the collected performance data that should be presented in reports
Reporting on the alerts status for the monitored instance
Description:
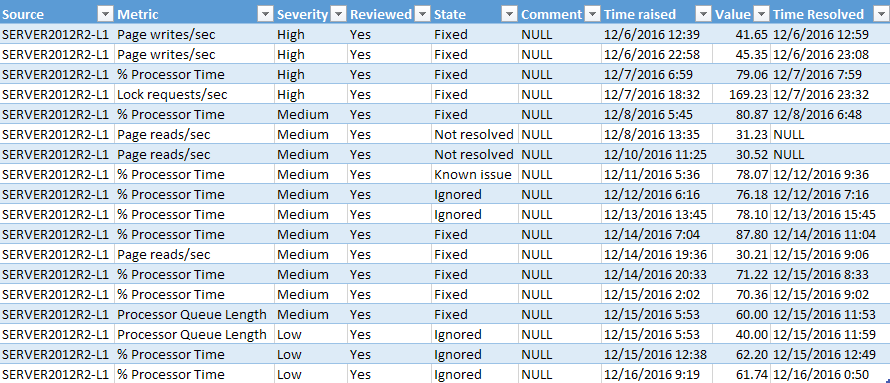
This report is designed to provide the spreadsheet view on the status of alerts raised for the specified time period. All the necessary information for all alerts raised on all monitored instances will be retrieved from the central repository database and formatted for the direct use in reports. For better perception, script will sort alerts by severity and then by time raised, but the user can easily modify this to meet own needs if needed
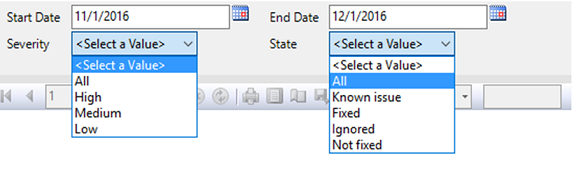
This particular example will display the detailed information on all alerts raised in November (as All is used as value for @State and for @Severity variable)
The .rdl file provided for this report allows full customization and user can select all parameters from the predefined drop-down lists
Inputs:
- Start date
- End date
- Alert state
- Alert severity
- SQL Server name
Definition:
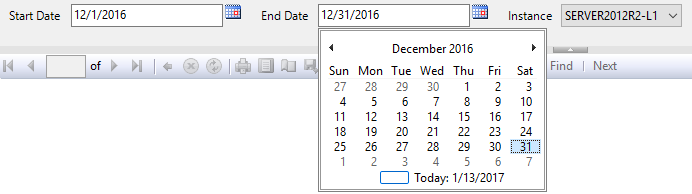
-- Set the time range (this is just an example, and this part of query will be replaced when using in reporting application or SSRS with the parameters that will be feed directly from the application/SSRS)
---------------------------------------------------------------------
declare @StartDate datetimeoffset(7);
declare @EndDate  datetimeoffset(7);

declare @SourceId uniqueidentifier;

declare @State  int;
declare @Severity  int;

set @StartDate  = '2016-11-1 06:00:00.0000000 +01:00'
set @EndDate = '2017-1-14 06:00:00.0000000 +01:00'

set  @SourceId = [ApexSQL].[SourceNameToId] ('SERVER2012R2-L1')  -- Enter SQL Server name
set  @State  = [ApexSQL].[AlertStateToNumberConverter] ('All')  -- Enter Alert state that should be displayed in report (Not fixed, Fixed, Ignored, Known issue and All). When 'All' is entered, alert with all states will be displayed
set  @Severity  = [ApexSQL].[AlertSeverityToNumberConverter] ('All') -- Enter Alert state that should be displayed in report (High, Medium, Low and All). When 'All' is entered, alert with all severities will be displayed


 -- Return detail information of alerts raised in the specified time period
---------------------------------------------------------------------
   SELECT
		  ApexSQL.SourceIdToName(A.[SourceId]) as Source,
		  ApexSQL.MetricIdToName(A.[MeasurementId]) as Metric,
		  ApexSQL.SeverityToStringConverter(A.[Severity]) as Severity,
          [ApexSQL].[AlertCheckToStringConverter](A.[Checked]) as Reviewed,
          [ApexSQL].[AlertStateToStringConverter](A.[State]) as [State],
		  A.[Comment],
          A.[TimeRaised],
          MM.Value,
          A.[TimeResolved],
          A.[UserResolved]
  FROM [ApexSQLMonitor].[ApexSQL].[MonitorAlerts] A
  LEFT JOIN ApexSQL.MonitorMeasuredValues MM ON [MeasuredValueId] = MM.Id
  	WHERE A.TimeRaised > @StartDate AND A.TimeRaised < @EndDate AND (A.State = @State or @State=4) and (A.Severity = @Severity or @Severity=4) AND A.SourceId in (SELECT * from ApexSQL.GetAllSourcesForMachine (@SourceID))
  		ORDER by A.Severity desc, A.TimeRaised
Output example:
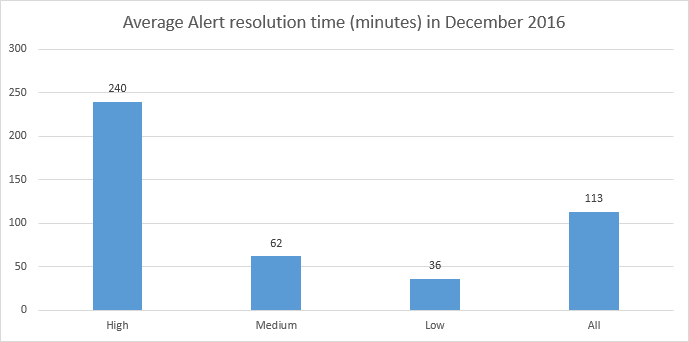
Report on the average time it takes to resolve alerts over period of time
This is the management oriented statistical report where the average values for alert resolution per specific alert severity as well as the total average time for all alert severities will be displayed. Such reports are interesting for getting insight in DBA efficiency in resolving various SQL Server issues occurred
The report is designed to allow user to display separate reports per each alert severity, or the report where average time taken for resolution of all alert severity for specified SQL Server. The report will display the average time for all alerts that are resolved within the specified time period
The provided .rdl file allows customization of this report by selecting the time period for this report, monitored instance and alert severity from the drop down list, so no need for any interaction with the script
Inputs:
- Start date
- End date
- Monitored Instance
Definition:
-- Set the time range (this is just an example, and this part of query will be replaced when using in reporting application or SSRS with the parameters that will be feed directly from the application/SSRS)
---------------------------------------------------------------------

declare @MachineName  nvarchar(256);
declare @ServerName  nvarchar(256);

declare @StartDate  int;
declare @EndDate int;
set @StartDate  = '2016-11-1 06:00:00.0000000 +01:00'
set @EndDate = '2017-1-14 06:00:00.0000000 +01:00'

set  @ServerName = [ApexSQL].[SourceNameToId] ('SERVER2012R2-L1')  -- Enter SQL Server name
set  @State  = [ApexSQL].[AlertStateToNumberConverter] ('All')  -- Enter Alert state that should be displayed in report (Not fixed, Fixed, Ignored, Known issue and All). When 'All' is entered, alert with all states will be displayed
set  @Severity  = [ApexSQL].[AlertSeverityToNumberConverter] ('All') -- Enter Alert state that should be displayed in report (High, Medium, Low and All). When 'All' is entered, alert with all severities will be displayed


-- report the average time needed to resolve alerts of different severities

SELECT
(AVG(DATEDIFF(SECOND, TimeRaised, TimeResolved))) /(60*60) as [Hours], 'High' as [Severity]  FROM ApexSQL.MonitorAlerts WHERE Severity = 3 AND TimeResolved is not NULL AND TimeResolved > @StartDate AND TimeResolved < @EndDate AND AND SourceId = @ServerName
UNION ALL
SELECT
(AVG(DATEDIFF(SECOND, TimeRaised, TimeResolved))) /(60*60) as [Hours], 'Medium' as [Severity]  FROM ApexSQL.MonitorAlerts WHERE Severity = 2 AND TimeResolved is not NULL AND TimeResolved > @StartDate AND TimeResolved < @EndDate
 UNION ALL
 SELECT
(AVG(DATEDIFF(SECOND, TimeRaised, TimeResolved))) /(60*60) as [Hours], 'Low' as [Severity]  FROM ApexSQL.MonitorAlerts WHERE Severity = 1 AND TimeResolved is not NULL AND TimeResolved > @StartDate AND TimeResolved < @EndDate
 UNION ALL
 SELECT
(AVG(DATEDIFF(SECOND, TimeRaised, TimeResolved))) /(60*60) as [Hours], 'All' as [Severity]  FROM ApexSQL.MonitorAlerts WHERE TimeResolved is not NULL AND TimeResolved > @StartDate AND TimeResolved < @EndDate
Output example:
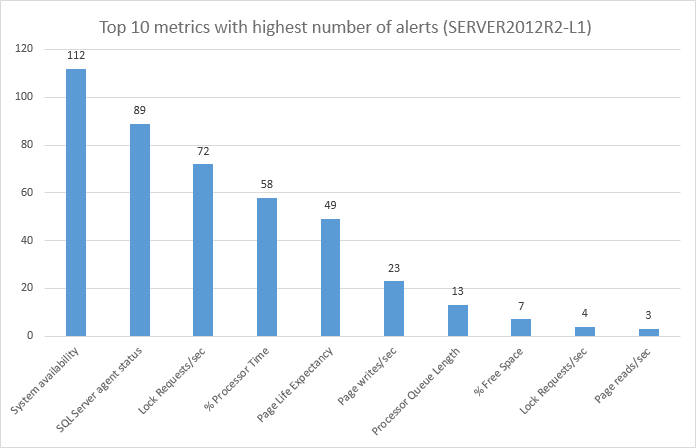
Top 10 metrics (all types) with highest number of alerts
This is a report similar to the previous, with the difference that it can display top ten alerts for all performance metrics on the monitored instance (System, SQL Server, Wait stats, Indexes, database etc)
This report provides the global overview of top 10 most critical metric for the monitored instance and for the selected alert severity (High, Medium, Low or All can be selected). It provides the good start for analysis of the performance problems by allowing to focus on the most critical performance metrics first
Included .rdl file allows full customization by providing selection for all input parameters from the drop-down lists
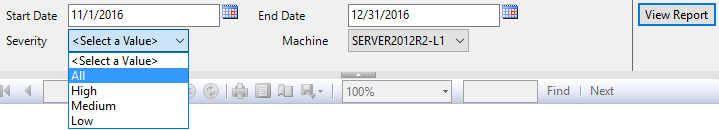
Inputs:
- Start date
- End date
- Machine name
- Severity of alert
Definition:
-- Set the time range (this is just an example, and this part of query will be replaced when using in reporting application or SSRS with the parameters that will be feed directly from the application/SSRS)
---------------------------------------------------------------------
declare @StartDate datetimeoffset(7);
declare @EndDate  datetimeoffset(7);

declare @ServerName  nvarchar(256);
declare @MachineName  nvarchar(256);

declare @State  int;
declare @Severity  int;

set @StartDate  = '2016-11-1 06:00:00.0000000 +01:00'
set @EndDate = '2017-1-14 06:00:00.0000000 +01:00'

set  @MachineName = [ApexSQL].[SourceNameToId] ('SERVER2012R2-L1')  -- Enter Machine name

set  @Severity  = [ApexSQL].[AlertSeverityToNumberConverter] ('All') -- Enter Alert state that should be displayed in report (High, Medium, Low and All). When 'All' is entered, alert with all severities will be displayed


-- Top 10 metrics with the highest number of SQL Server alerts

SELECT TOP 10 * FROM
(
SELECT ApexSQL.MetricIdToName ([MeasurementId]) As MetricName
       ,COUNT(*) as [Alert number]
  FROM [ApexSQLMonitor].[ApexSQL].[MonitorAlerts]
  WHERE SourceId in (SELECT * from ApexSQL.GetAllSourcesForMachine(@MachineName))
  AND (Severity = @Severity or @Severity=4)
AND @StartDate < TimeRaised AND @EndDate > TimeRaised
  GROUP BY [SourceId],[MeasurementId]
) as R
ORDER BY R.[Alert number] DESC
Outputs:
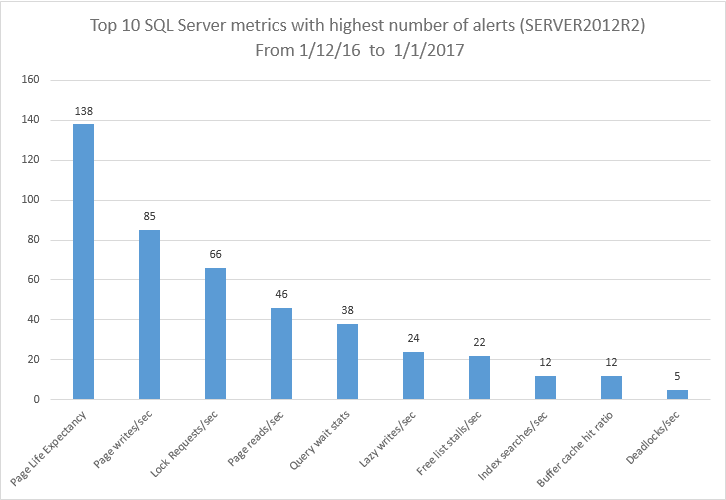
Top 10 SQL Server metrics with highest number of alerts
Description:
Unlike the previous report, this one is designed to display the top 10 SQL Server metrics only with the highest number of alerts raised for the specified period of time. The report allows user to display the top 10 metrics for a specific severity for which the statistic is required or to decide to display top 10 metrics with highest number of alerts regardless of the alert severity
The accompanied .rdl file allows full customization out of the box via ability to select all parameters from the offered lists in the drop-down menus

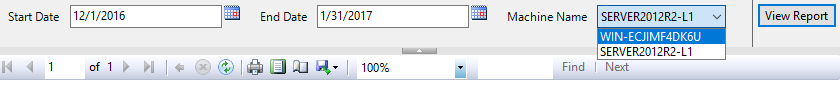
Inputs:
- Start date
- End date
- SQL Server
- Severity of alert
Definition:
-- Set the time range (this is just an example, and this part of query will be replaced when using in reporting application or SSRS with the parameters that will be feed directly from the application/SSRS)
---------------------------------------------------------------------
declare @StartDate datetimeoffset(7);
declare @EndDate  datetimeoffset(7);
declare @ServerName  nvarchar(256);
declare @Severity  int;

set @StartDate  = '2016-11-1 06:00:00.0000000 +01:00'
set @EndDate = '2017-1-14 06:00:00.0000000 +01:00'

set  @ServerName = [ApexSQL].[SourceNameToId] ('.')  -- Enter SQL Server name

set  @Severity  = [ApexSQL].[AlertSeverityToNumberConverter] ('All') -- Enter Alert state that should be displayed in report (High, Medium, Low and All). When 'All' is entered, alert with all severities will be displayedSELECT


-- Top 10 metrics with the highest number of SQL Server alerts

SELECT TOP 10 * FROM
(
SELECT ApexSQL.MetricIdToName ([MeasurementId]) As MetricName
       ,COUNT(*) as [Alert number]
  FROM [ApexSQLMonitor].[ApexSQL].[MonitorAlerts]
  WHERE SourceId in (SELECT * from ApexSQL.GetAllSourcesSQLServer (@ServerName))
  AND (Severity = @Severity or @Severity=4)
AND @StartDate < TimeRaised AND @EndDate > TimeRaised
  GROUP BY [SourceId],[MeasurementId]
) as R
ORDER BY R.[Alert number] DESC
Outputs:
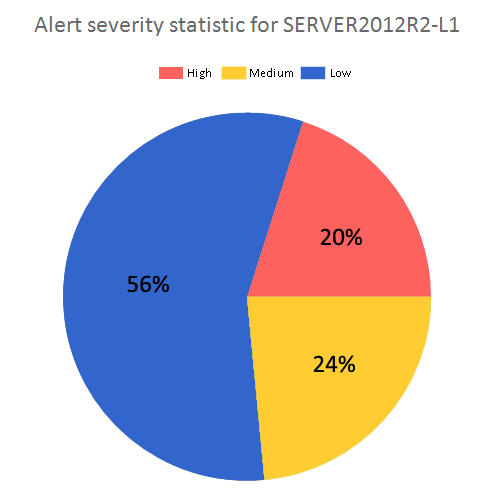
Statistical distribution of alerts based on severity for a specified period of time
This type of report is useful for providing the insight in the distribution of alert severities over a period of time, and thus the insight into the state and fitness of the server over that time period. This report will display the percentage of High, Medium and Low alerts for all performance metrics on the selected monitored instance. This is the graphical pie chart type of reports
The SSRS report included allows customization by selecting the time period and the monitored instance for which the report will be created
Inputs:
- Start date
- End date
- Monitored instance
Definition:
-- Set the time range (this is just an example, and this part of query will be replaced when using in reporting application or SSRS with the parameters that will be feed directly from the application/SSRS)
---------------------------------------------------------------------
declare @StartDate datetimeoffset(7);
declare @EndDate  datetimeoffset(7);

declare @MachineName  nvarchar(256);

set @StartDate  = '2016-12-05 00:00:00.0000000 +01:00'
set @EndDate = '2017-1-15 00:00:00.0000000 +01:00'

set  @MachineName  = ApexSQL.SourceNameToId ('SERVER2012R2-L1') -- Enter machine/computer name

-- This is the main part of the script that returns the X(Type),Y(Value) table.
-- It is useful for status metrics with two states e.g system aviability
---------------------------------------------------------------------
SELECT ApexSQL.AlertSeverityToStringConverter (X) as Severity, Y
FROM [ApexSQL].[AlertSeverityPieChart] (
   @StartDate,
   @EndDate,
   @MachineName )
Outputs:
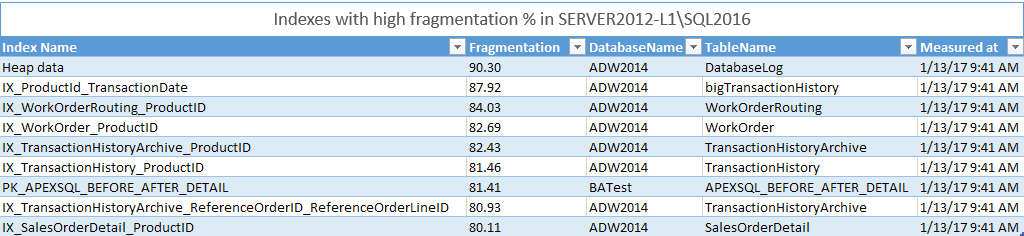
Report on Indexes with fragmentation above xx% in specified SQL Server
Description:
Report that will show all indexes for the specified SQL Server that have average fragmentation higher than the value defined by the user. This report is the primary report for getting the insight into the state of the index fragmentation on the targeted SQL Server. It will allow quick identification and analysis of all highly-fragmented indexes across the different databases for that SQL Server. This is the tabular report that provides all the important information for each index that is listed
This report is great for the immediate insight in potential issues with the indexes on the target server, but it more oriented to some small to medium environment or for archival and analytical purposes when used in the larger environments. For SQL Servers with large number of databases and large number of tables in those databases, this report could be impractical for some more detailed analysis due to huge amount of data that can be displayed in such report. For such big environments, please refer to the next report
The accompanied .rdl report is fully customizable and allows user to select the target SQL Server as well as the fragmentation level in % from the drop down list
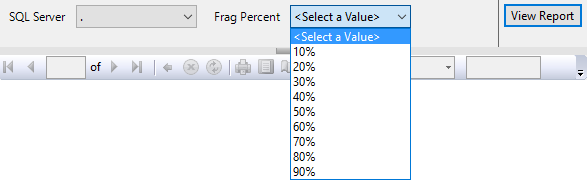
Inputs:
- Start date
- End date
- SQL Server
- Fragmentation level in %
Definition:
-- Set the time range (this is just an example, and this part of query will be replaced when using in reporting application or SSRS with the parameters that will be feed directly from the application/SSRS)
---------------------------------------------------------------------

declare @MeasurementId uniqueidentifier;
declare @ServerId uniqueidentifier;
declare @DatabaseId uniqueidentifier;
declare @Fragmentation int;

set @MeasurementId = ApexSQL.MetricNameToId('AvgFragmentationInPercent') --This is where the Average index fragmentation % metric is set (Do not change)

set @ServerId = ApexSQL.SourceNameToId ('.') --Enter the SQL Server name here

set @Fragmentation = 80 --Minimal fragmentation percent of index to be displayed in report. Set the value between 0 and 100 (usual value is 70 - 80)

--Report on indexes with Fragmentation % higher than selected for the specified SQL Server (for all databases)

select ApexSQL.[SourceIdToName](
	R.[SourceId]) as [Index Name],
    R.[Value] as [Fragmentation],
    MI.[DatabaseName],
	MI.[TableName],
	R.[MeasuredAt]

from (
     select M.[SourceId],
            M.[MeasurementId],
            M.[Value],
   M.[MeasuredAt],
            row_number() over(partition by M.SourceId,M.MeasurementId order by M.MeasuredAt desc) as rn
     from [ApexSQL].[MonitorMeasuredValues] as M
  WHERE M.MeasurementId = @MeasurementId AND
  M.SourceId in
  (SELECT * FROM ApexSQL.GetAllIndexesForServer (@ServerId)
   )) as R
   LEFT JOIN [ApexSQL].[MonitorIndexes] MI on MI.Id=R.SourceId
where R.rn <= 1 and R.Value > @Fragmentation
ORDER BY R.[Value] DESC, MI.[DatabaseName]
Output example:
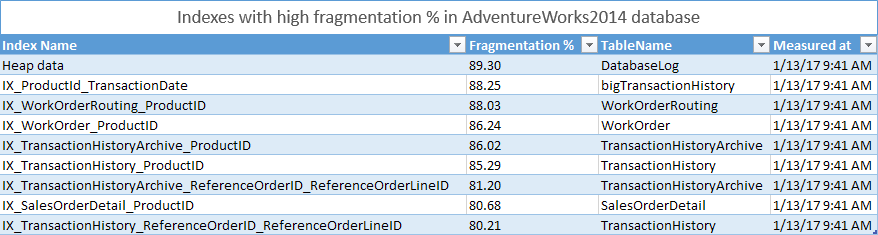
Report on indexes with Fragmentation above xx% in a specified database
Description:
This is the report that will list all indexes with fragmentation percent higher than the value specified by the user for the user selected database. This report is particularly interesting for large systems with large number of databases and tables. Unlike previous report that could be too broad, report like this can provide more usable/readable information only for the specific database(s) allowing much easier analysis without unnecessary distractions
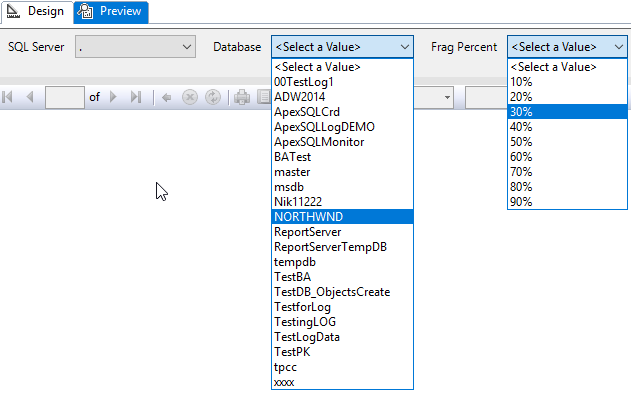
Provided SSRS report .rdl file is fully customizable and designed to prevent user mistakes as the user must select the specific SQL Server first and then report will allow him to select the database from the list of the database retrieved for the selected SQL Server
Once the server is selected, database drop down list will allow selecting the database hosted on selected SQL Server. Of course, the fragmentation percent can be selected as well
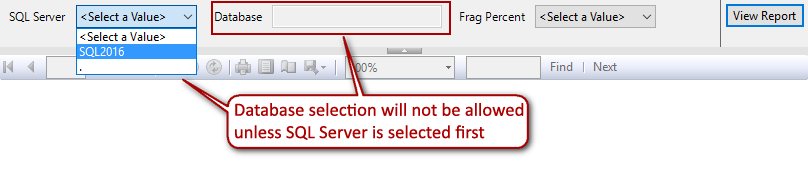
Once SQL Server is selected, the Database drop down list will be enabled with list of the databases hosted in the selected SQL Server
Inputs:
- Start date
- End date
- SQL Server
- Database name
- Fragmentation level in %
Definition:
-- Set the time range (this is just an example, and this part of query will be replaced when using in reporting application or SSRS with the parameters that will be feed directly from the application/SSRS)
---------------------------------------------------------------------

declare @MeasurementId uniqueidentifier;
declare @ServerId uniqueidentifier;
declare @DatabaseId uniqueidentifier;

set @MeasurementId = ApexSQL.MetricNameToId('AvgFragmentationInPercent') --This is where the Average index fragmentation % metric is set (Do not change)

set @ServerId = ApexSQL.SourceNameToId ('.') --Enter the SQL Server name here

set @DatabaseId = ApexSQL.SourceNameToId ('ADW2014') --Enter the database name here for which report should be created

set @Fragmentation = 80 --Minimal fragmentation percent of index to be displayed in report. Set the value between 0 and 100 (usual value is 70 - 80)


--Report on indexes with Fragmentation % higher than selected for the specified database that is hosted in the specified SQL Server

select ApexSQL.[SourceIdToName](
	R.[SourceId]) as [Index Name],
    R.[Value] as [Fragmentation],
   	MI.[TableName],
	R.[MeasuredAt]

from (
     select M.[SourceId],
            M.[MeasurementId],
            M.[Value],
   M.[MeasuredAt],
            row_number() over(partition by M.SourceId,M.MeasurementId order by M.MeasuredAt desc) as rn
     from [ApexSQL].[MonitorMeasuredValues] as M
  WHERE M.MeasurementId = @MeasurementId AND
  M.SourceId in
  (SELECT * FROM ApexSQL.GetAllIndexesForDatabase (@DatabaseId)
   )) as R
   LEFT JOIN [ApexSQL].[MonitorIndexes] MI on MI.Id=R.SourceId
where R.rn <= 1 and R.Value > 10
ORDER BY R.[Value] DESC
Outputs:
Top 10 databases with largest log growth for a specified period of time
Description:
This report provides top 10 databases with highest log file growth over a specified period of time. Such reports are necessary for identifying databases that have the most log file growth and for prediction on where and how soon the storage space issue might be experienced
The included .rdl file allows user to select time range for the report as well as the SQL Server instance for which the report will be created

Inputs:
- Start date
- End date
- SQL Server
Definition:
declare @StartDate datetimeoffset(7);
declare @EndDate  datetimeoffset(7);
declare @MetricId uniqueidentifier;
declare @ServerId  uniqueidentifier;

set @StartDate  = '2016-12-01 06:00:00.0000000 +01:00'-- Enter the report start date/time
set @EndDate = '2016-12-30 06:00:00.0000000 +01:00' -- Enter the report end date/time
set @ServerId = ApexSQL.SourceNameToId ('.')  -- Enter SQL Server name
set @MetricId = ApexSQL.MetricNameToId('Log Growths')

	  SELECT Top 10 ApexSQL.SourceIdToName (r.SourceId) as [Database], R.Y as [Log growths] FROM
	  (
	  SELECT SourceId, SUM (Value) as Y
      FROM   [ApexSQL].[MonitorMeasuredValues]
      WHERE MeasuredAt >= @StartDate AND MeasuredAt <= @EndDate  AND
			MeasurementId = @MetricId AND
			SourceId in (SELECT * FROM ApexSQL.GetAllSourcesSQLServer (@ServerId))
      GROUP BY SourceId
	  ) as R
	  ORDER by R.Y DESC
GO
Outputs:

Downloads
Please download the script(s) associated with this article on our GitHub repository
Please contact us for any problems or questions with the scripts.
In the next part of the article, the report set on Wait statistic and Query waits will be presented
All articles in this series:
- How to create custom SQL Server performance reports – Part 1 (Performance and status metrics)
- How to create custom SQL Server performance reports – Part 2 (alerts, Indexes and databases)
- How to create custom SQL Server performance reports – Part 3 (Wait statistics and Query waits)


