


Applies to
ApexSQL Monitor
Summary
This article explains explain how to use ApexSQL Monitor AlwaysOn monitoring which will provide quick insight into the state of an AlwaysOn high availability environment. The graphically presentation of the high availability AlwaysOn environment allows users to visually ascertain the status of the Windows Server Failover Cluster nodes as well as the status of SQL Server AlwaysOn replicas. This visualization also allows for identifying health issues thanks to visualized data flow and color highlighting of the statuses and issues
Description
When monitoring AlwaysOn Availability Groups using ApexSQL Monitor, the complete topology of the monitored availability group including the Windows Server Failover Cluster (WSFC) and all AlwaysOn Availability Groups that shares the same availability replicas is presented. AlwaysOn real time and historical metrics data, metrics and alerts configuration, graphical presentation of the AlwaysOn environment, as well as the tables with important data related to monitored AlwaysOn Availability Group are all part of ApexSQL Monitor AlwaysOn performance monitoring
FAQs
What AlwaysOn Availability Group metrics can be monitored?
The following Availability replica metrics can be monitored:
-
AlwaysOn Failover
-
Availability replica connected state
-
Availability replica operational state
-
Availability replica recovery health
-
Availability replica role
-
Availability replica synchronization health
-
Bytes received from replica per second
-
Bytes sent to replica per second
-
Bytes sent to transport per second
-
Receives from replica per second
-
Sends to replica per second
-
Sends to transport per second
The following Availability database metrics can be monitored:
-
Availability database log send queue (KB)
-
Availability database recovery queue (KB)
-
Availability database state
-
Availability database synchronization health
-
Availability database synchronization state
Where can the AlwaysOn Availability Group metrics can be configured
After adding the AlwaysOn Availability Group as described in the How to add AlwaysOn Availability Group for monitoring KB article, AlwaysOn related metrics can be configured in the Metrics screen.
-
To access the metrics screen, use the Configure -> Metrics link
-
Select the replica in the AlwaysOn group in the tree-view pane on the left
-
Select the Metrics tab and scroll down to the bottom of the screen where two AlwaysOn metrics group are displayed – Availability replica metrics and Availability database metrics

-
The settings can be configured in the standard way, as described in the How to configure ApexSQL Monitor KB article
Where can the AlwaysOn Availability Group topology is presented?
By selecting the AlwaysOn title in the tree-view pane and then Dashboard from the main menu, the AlwaysOn dashboard page will be displayed
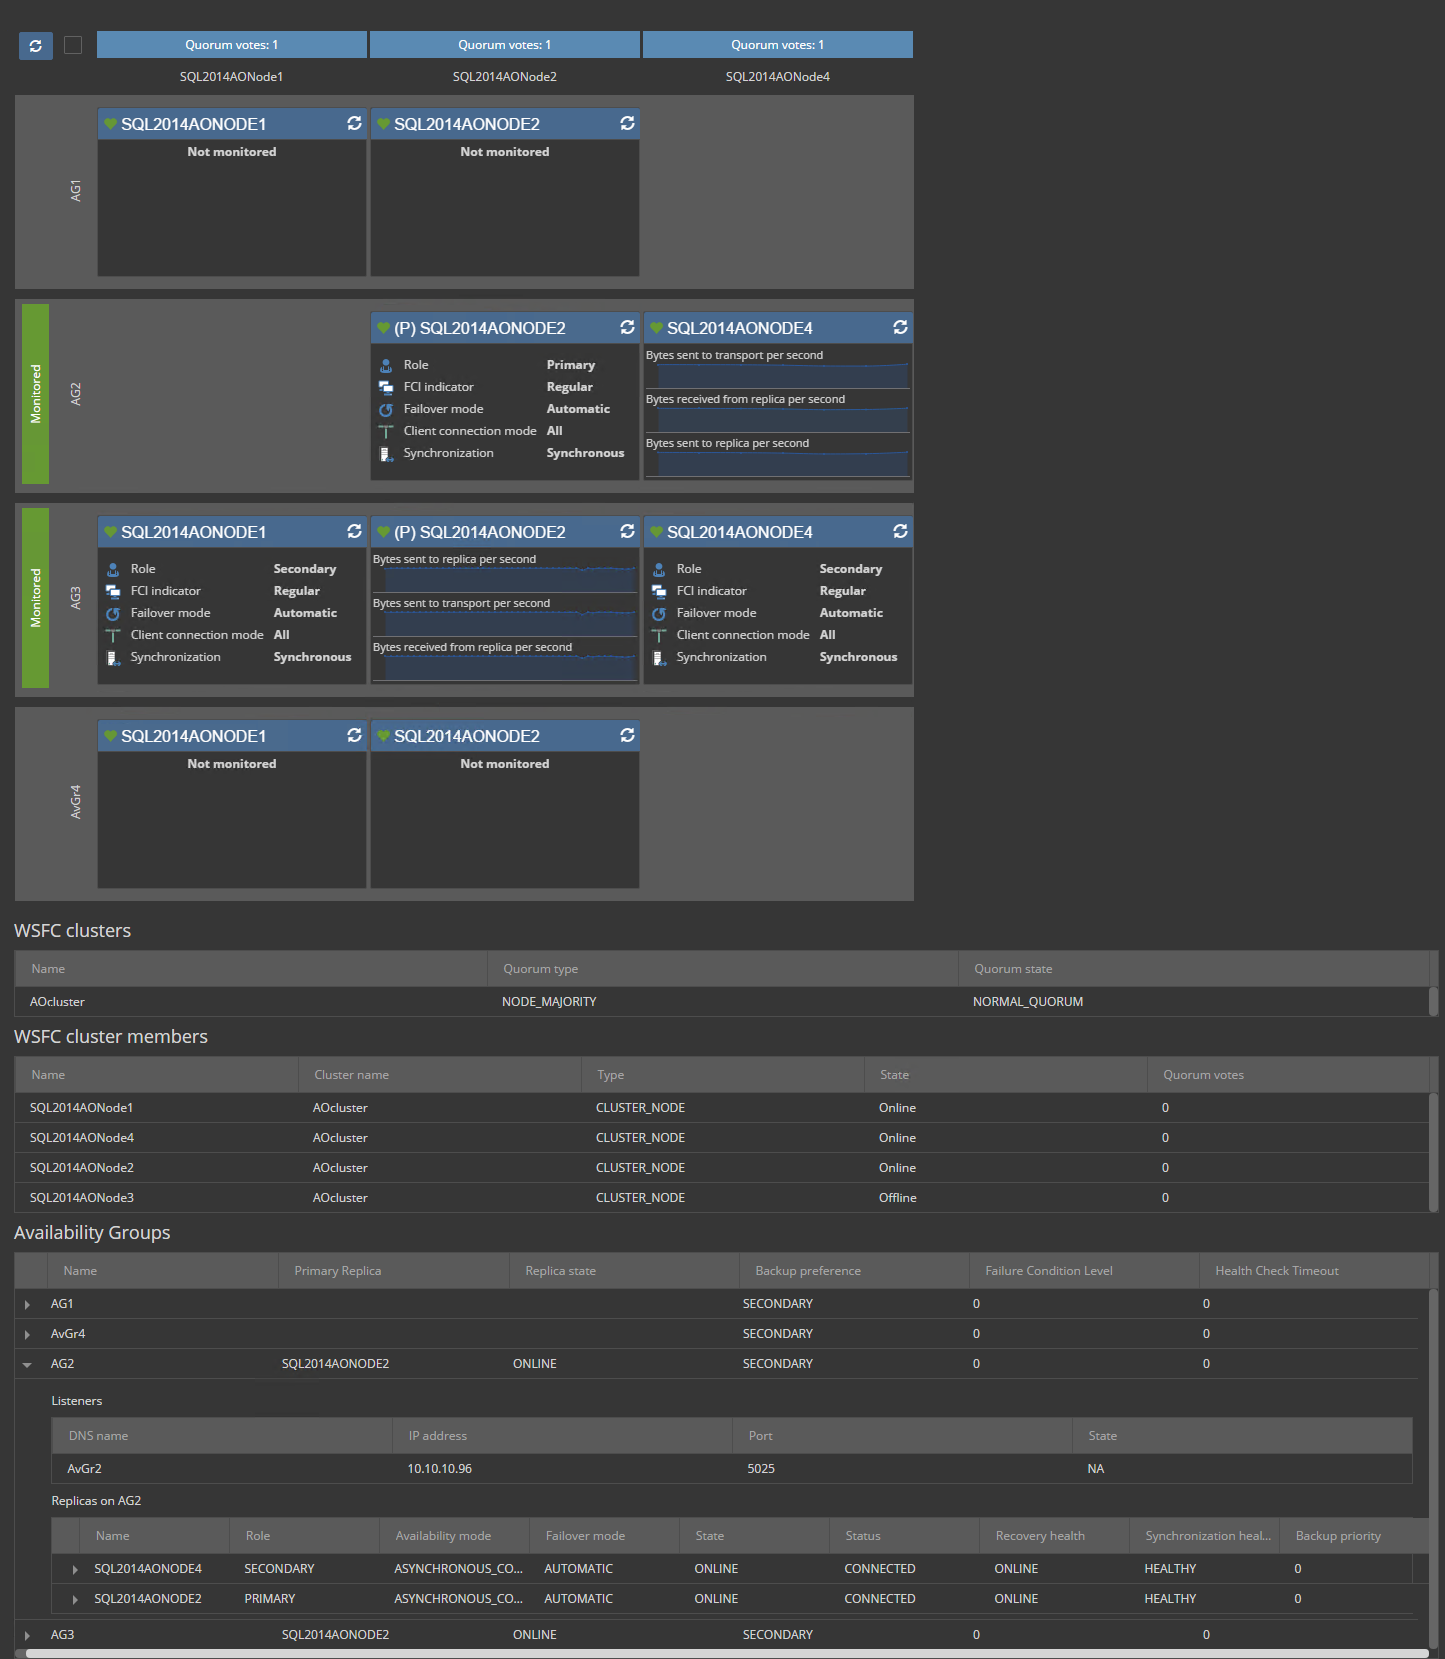
The application is capable of providing and resolving the complete WSFC and AlwaysOn structure of the complete environment, not just for AlwaysOn listener added for monitoring, but only the replicas and WSFC that are part of the added AlwaysOn Availability Group will be monitored. The AlwaysOn groups, that are not explicitly added, will be displayed but without data. Their appearance in the diagram will be indicated with “Not monitored” text in their replica panels
What AlwaysOn Availability Group information is immediately available in the AlwaysOn dashboard?
The AlwaysOn dashboard provides the immediate access to the following global information for the monitored AlwaysOn Availability Group:
-
The way Availability Groups (AG) and Failover Cluster Instances (FCI) are distributed across the Windows Server Failover Cluster (WSFC) nodes
-
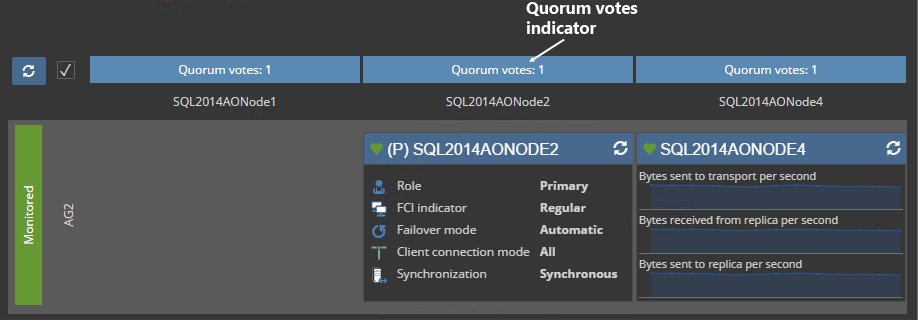
The Windows Server Failover Cluster (WSFC) nodes quorum vote state and number
-
Easily identification of the primary replica for each AlwaysOn AG
-
Easily identify databases that are associated to each AlwaysOn AG
-
The fast insight in the replica health
-
The fast insight in the replica failover state
-
The relation between the AlwaysOn AG and the Failover Cluster Instance (FCI) if any
-
Indication of data volume between the replicas
-
Indication of data rate between the replicas
What is the meaning and purpose of the various graphical elements in the AlwaysOn replica graphical overview?
The replica related graphical elements
The default AlwaysOn replica panel view:
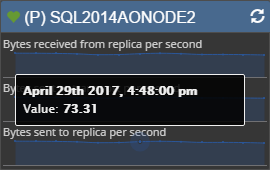
The default replica panel view displays the chart for three important AlwaysOn metrics:
- Bytes sent to transport per second
- Bytes received from replica per second
- Bytes sent to replica per second
Hoovering above the charts values indicators will display the actual metric value alongside with the date and time the value is collected
The AlwaysOn replica information panel view:
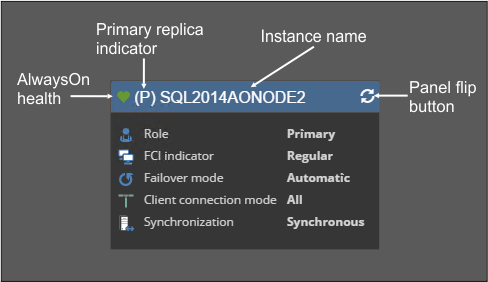
Primary replica indicator –Indicates the Primary replica
Instance name – The name of SQL Server that hosts the AlwaysOn replica
Panel flip button – Flips the panel to display the AlwaysOn metric charts or information
AlwaysOn health – This is the color indicator of the AlwaysOn AG health, and it can be green or red color.
Green – AlwaysOn AG health state is OK
Red – AlwaysOn AG is in unhealthy state
Replica role – The replica role can be Primary or Secondary role
 FCI indicator – Show whether the replica is SQL Server Failover Cluster Instance (FCI) or regular SQL Server instance
 Failover mode – Indicates whether the AlwaysOn replica is set in manual or automatic failover mode
![]() Client connection mode – The client connection mode have a different nature for primary and secondary replica client connections
Client connection mode – The client connection mode have a different nature for primary and secondary replica client connections
The primary replica connection modes:
All – This is the default connection mode for the primary role and it allows read-write and read only connections to primary replica databases
Read-write only – This indicate that only connections where the “Application intent” is set to “ReadWrite” or is not set at all will be allowed. The connections where “Application intent” is set to “ReadOnly” are not allowed (usually set in order to prevent unnecessarily reading from primary replica instead from the secondary)
The secondary replica connection modes:
None – This is the default connection mode for the secondary replica and it will prevent any read access to secondary replica databases
 Full Read only – No restrictions are imposed regardless of what Application intent is set for a connection
 Only read-only – This indicate that only connections where the “Application intent” is set to “ReadOnly” will be allowed. The connections where the “Application intent” is set to “ReadWrite” or is not set at all will not be allowed (such setting is usually to prevent impact on the performance of replica with unnecessary connections where the clear intent for reading only is not evident)
What is the meaning and purpose of various graphical elements in the AlwaysOn AG graphical diagram?
Quorum details for each WSFC node – The panel above the WSFC node name displays the number of quorum votes that this WSFC node have
When hoovering over the connector arrow. S tooltip will pop up where Bytes sent to replica per second value will be displayed as well as the breached threshold value and type (Low, Med or High)
Can I get additional data of AlwaysOn performance in the AlwaysOn dashboard?
Yes. The bottom area of the AlwaysOn dashboard, below the AlwaysOn graphical diagram, comprises multiple AlwaysOn information broken in tables, where each table allows additional drill down to reach required information quick and easy. By expanding Availability group -> Listeners -> Replica on <node_name> node -> Databases on <node_name> will list all user databases with associate information that are associated to the particular AlwaysOn replica. This feature that can be cumbersome to achieve via SQL Server Management Studio for example


