Applies to
ApexSQL Monitor
Summary
This article explains how to create and set up custom SQL metrics for monitoring the SQL Server. Custom SQL metrics are T-SQL based queries that can be created in ApexSQL Monitor to collect calculated performance data
Description
While ApexSQL Monitor displays an extensive range of the standard SQL Server and Operating System performance metrics, it is also featured with the capability to add custom performance counters that can be used for some on-demand monitoring specific to the various systems, but also for historical trending and alerts
To create the needed metric in ApexSQL Monitor, follow the steps:
-
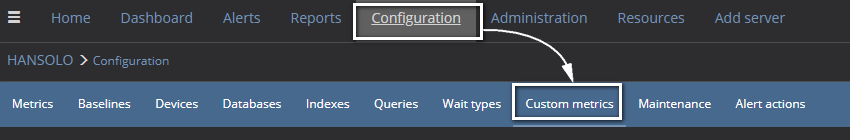
Click on the Configuration link in the main menu and select the Custom metric tab
- To create the new custom metric, press the Add button. It will open the Add custom metric page
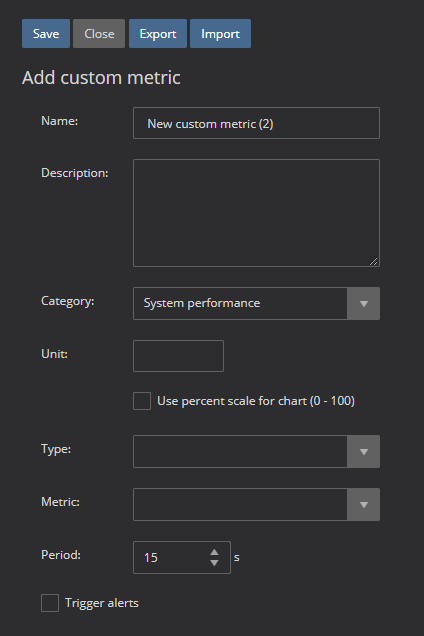
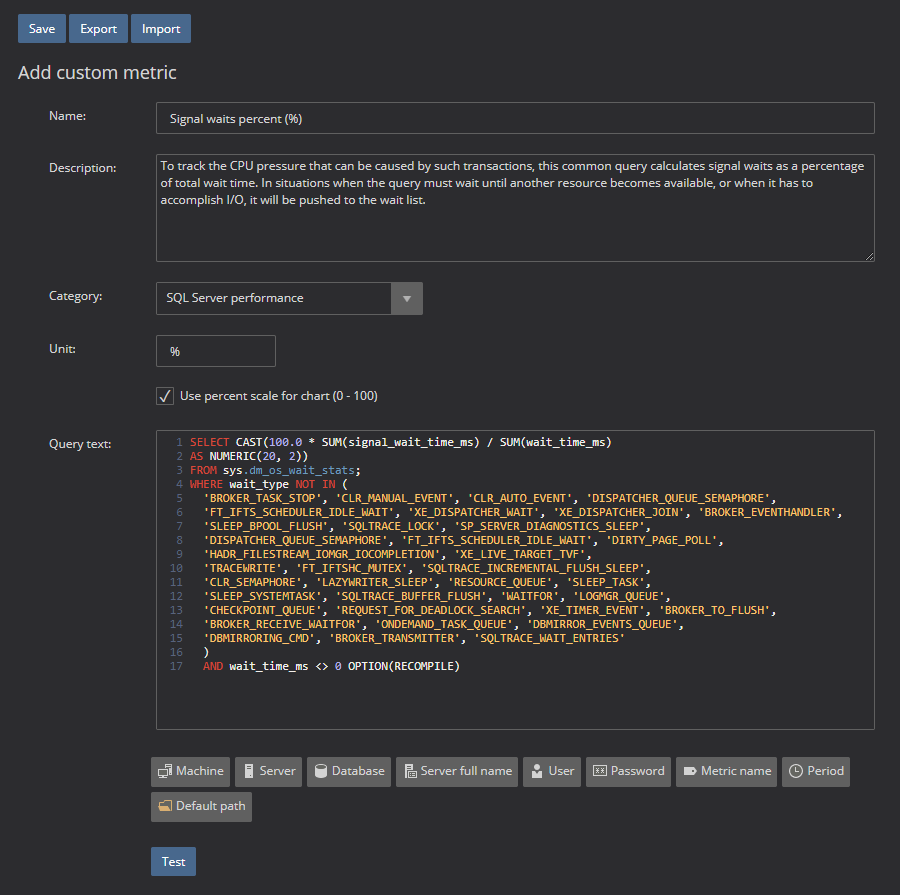
Now the new custom metric can be created. Let’s review a worked example:
- Name field – Set the name for the new metric in the Name field (i.e., Signal waits percent)
- Description field – allows entering any text that will provide a closer description of the created counter.
- Performance category – the drop-down menu allows selecting one of the three performance metric categories: System, SQL Server, and Database performance
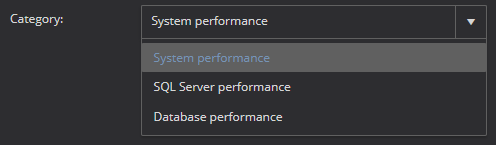
- System performance – ApexSQL Monitor offers a large selection of predefined system counters available to users who want to monitor Windows OS for extra performance data or need some specific parts of Windows system
- System performance – ApexSQL Monitor offers a large selection of predefined system counters available to users who want to monitor Windows OS for extra performance data or need some specific parts of Windows system
There are seven metrics groups available: Browser, Memory, Redirector, Server, System, Objects, Cache
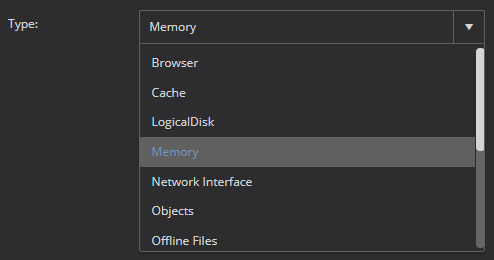
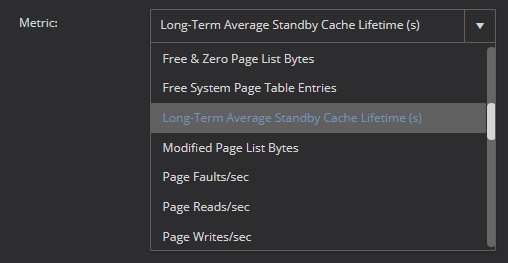
Each of these groups has its set of predefined system metrics that can be selected from the Metric drop down menu
-
- SQL Server performance – allows creating a custom T-SQL based metric. The custom created script will be executed at the SQL Server level only once for that monitored instance.
- Database performance – also allows creating a custom T-SQL based metric, but with the difference from the SQL Server performance metric described above that the custom script will be executed automatically against each monitored database that is hosted by the monitored SQL Server instance.
- SQL Server performance – allows creating a custom T-SQL based metric. The custom created script will be executed at the SQL Server level only once for that monitored instance.
Unit – This is a custom SQL Server or database performance counter measurement unit, that displays on the performance metric chart (i.e., %, Seconds, MB/sec, transactions, etc.)
Use percent scale for chart (0-100) – Select this check box when metric calculation returns a percentage value. Checking it ensures that the chart highest value displayed on y-axis does not exceed 100%. That allows the chart to be appropriately scaled by limiting the maximal value displayed on the scale to 100% even when the value is close or reach 100%
Query text – This is the T-SQL script that is the basis of the custom metric. The script must return a single positive numeric value (it must return only one column with one row)
When entering the query text, ApexSQL Monitor allows using predefined literals that will be replaced with processed values during the query execution.
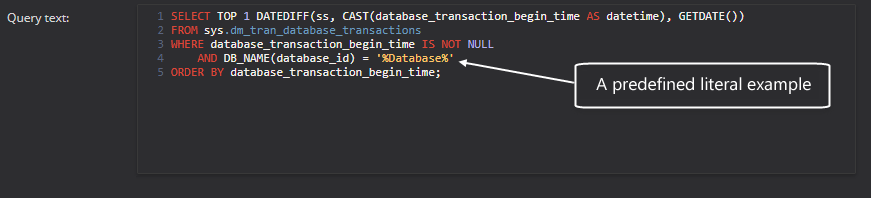
Predefined literals can be added directly in the text by clicking on the adequate predefined literals buttons, but also by typing it directly
Once everything is set as desired, test the metric’s T-SQL script in order to be sure that it executes without errors. Click on the Test button and select the SQL Server from the drop-down menu to be used for the test
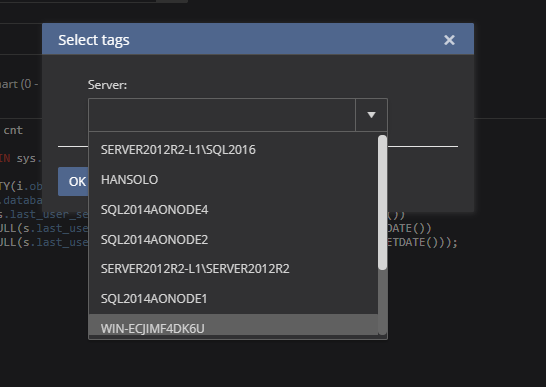
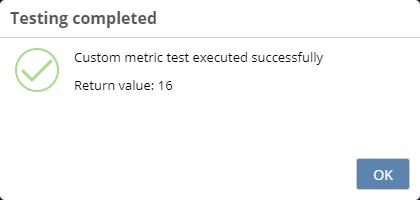
Press the OK button. The test result should display that test is executed successfully including the result of the query execution
After the successful test of the metric, set up the rest of the metric parameters that will determine the behavior of the metric and its configuration

Period – The represents the period in seconds between two consecutive executions of the custom metric. The period regulates the frequency of the custom script execution, e.g. how often the custom counter collects the performance data from the target instance (i.e., 60 seconds)
Metric return type – There are four different calculations of custom SQL performance counter types. Here is how the value returned by the script will be calculated:
- Execution: When this type is selected, the resulting value returned by the query will be collected for each execution of a query, stored as is in the repository database and used for displaying in the chart (this is the choice to be used for our custom metric example)
- Delta: The value that will be displayed in the chart has calculated as the difference between two consecutive executions of a query, and the result of calculation must be the positive value.
The values that will be stored in the repository database is calculated as:
stored_value(1)= value(2) – value(1), stored_value2= value(3) – value(2) … stored_value(N)= value(N) – value(N-1)
This is the calculation generally used for cumulative metrics when it is crucial to identify the pressure on the server in various periods of time that is the consequence of the changes between measurements.
- Rate: Similar to the previous, this is the difference between two consecutive executions of a query, divided by the time passed between those two executions. Again, the result of calculation must be a positive value. This is a metrics that is mostly used when it is essential to detect whether the pressure on the SQL Server is the consequence of the rate of change
- Execution time – The time (in milliseconds) it takes to execute the query. It is a useful custom SQL counter for testing the behavior of a specific query during different periods of the day or week, but also for determining the SQL Server pressure and performance variations over the time
Trigger alerts – When checked, this option enables configuring alerts to be triggered for the custom metric depending on the value that it returns
- Thresholds – enables configuring the three threshold values: low, medium, and high. Each alert severity is displayed in different status colors: low, medium, and high (10, 20 and 30 respectively in our example)
- Trigger alerts for values above defined threshold and Trigger alerts for values below defined threshold – These options are pretty self-explanatory and what should be selected depends on whether the expected value is “bad” when it is lower or higher than normal
- Alert period – Alerts will be triggered only when all measured values returned during the specified period have exceeded the defined threshold value. By carefully setting the alert period, a number of alerts can be significantly reduced to prevent the excessive number of alerts. This is the excellent way to suppress excessive alerting on occasional peaks that are not causing any troubles and could be considered normal
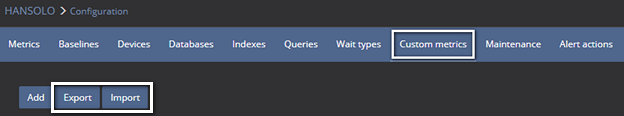
The Export button allows exporting each newly created or edited custom metric into an XML based file, that can be easily imported on demand using the Import button
After creating a new custom metric (or importing it), it is not automatically set as an active metric. To start using the newly added custom metric, select the server name in the Server list pane on the left and press the Configuration link (to activate metric for a specific group, select the group name; to activate metric for all monitored servers, select All instances)
In the Metrics page, select the checkbox next to the metric name
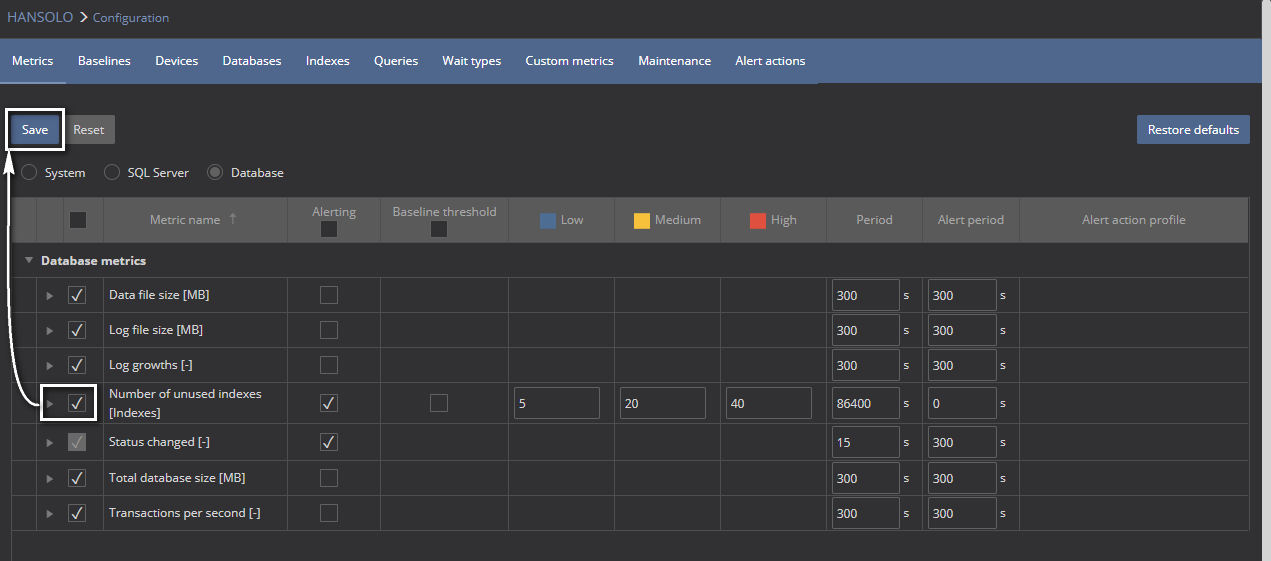
Press the Save button to start using the metric in the monitoring process
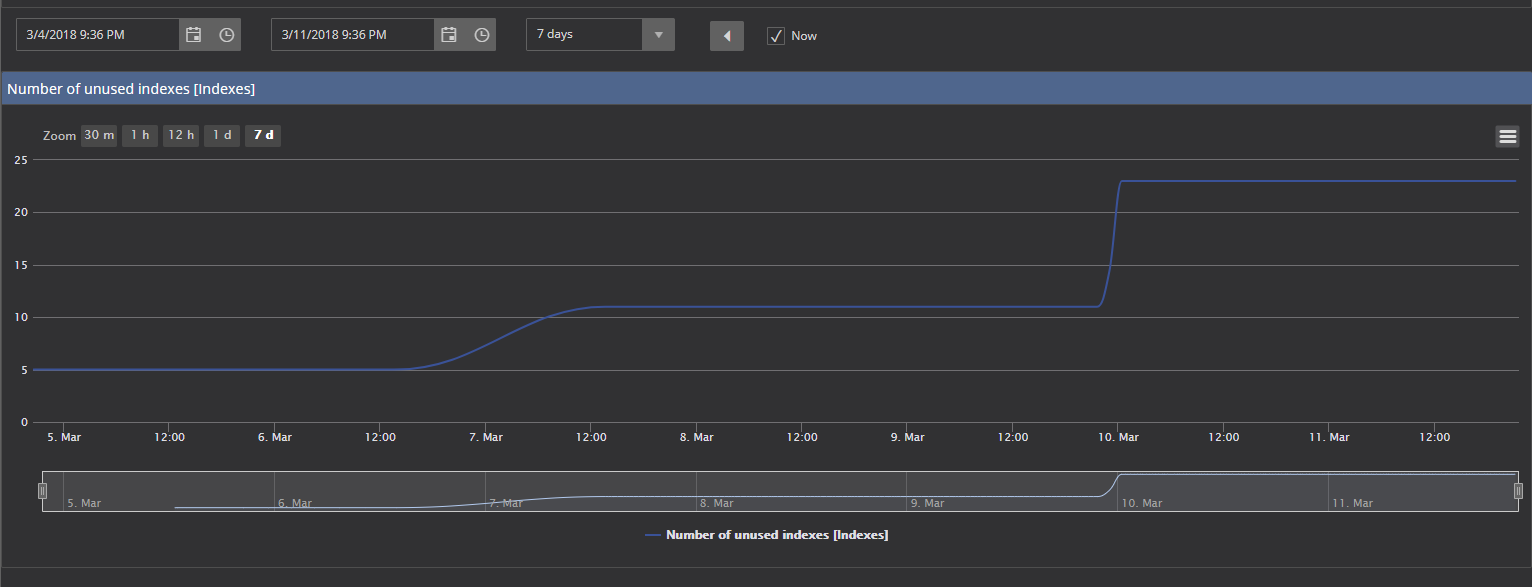
After the metric is configured, the custom metric chart is available on the appropriate details page (in our example in the database details page for the selected database).