


In Part 1 of the series, custom reporting on performance metrics and status metrics were presented. Part 2 covered custom reporting on indexes, alert statistic and database status. In this final part, various custom reports on the wait statistic and query waits will be presented. By combining those reports, the user can get a good idea about where are the hot spots in the monitored environment or to narrow down the performance issue to the root cause by identifying the problematic queries
Top 10 queries with highest wait time per monitored SQL Server
Description: This is the high-level report that allows the user to get a better insight into queries with the highest wait times on a specific SQL Server.
The example below will show the top 10 queries with highest wait time for January for specified SQL Server
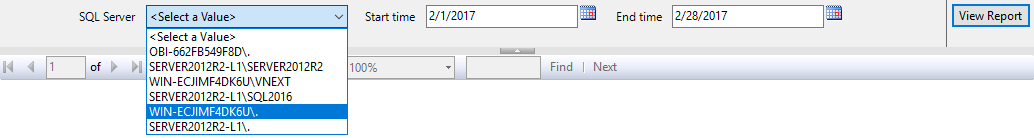
The .rdl file provided with this report allows the user to select time range and SQL Server from the pre-populated drop-down lists
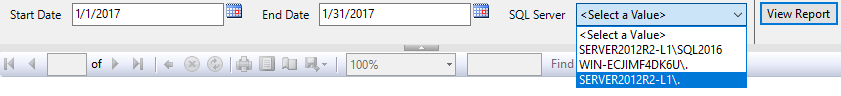
Inputs:
- Start date
- End date
- SQL Server name
Definition:
DECLARE @DatabaseId uniqueidentifier
DECLARE @SourceId uniqueidentifier
DECLARE @StartTime datetimeoffset(7)
DECLARE @EndTime datetimeoffset(7)

set @StartDate  = '2017-1-1 06:00:00.0000000 +01:00'
set @EndDate = '2017-1-21 06:00:00.0000000 +01:00'


SET @SourceId = [ApexSQL].[SourceNameToId] ('WIN-ECJIMF4DK6U')  -- Enter SQL Server name

 -- Return Top 10 queries with highest wait time over the specified time period for the selected database
---------------------------------------------------------------------
SELECT TOP 10
       QW.[SqlHandle] as [Query handle]
	  ,MAX(QT.[SqlText]) as [T-SQL]
      ,SUM([WaitTime]) as [Total wait]
	  ,MAX(MD.[DatabaseName]) as [Database]
      ,QW.[PlanHandle] as [Plan handle]

  FROM [ApexSQLMonitor].[ApexSQL].[MonitorQueryWaits] QW
  LEFT JOIN ApexSQL.[MonitorQueryTexts]  QT ON QW.QueryTextId = QT.Id
  LEFT JOIN ApexSQL.[MonitorDatabases] MD ON QW.DatabaseNameId = MD.Id
  WHERE QW.SourceId = @SourceId AND QW.DatabaseNameId = @DatabaseId AND [MeasuredAt] >= @StartTime AND [MeasuredAt]<= @EndTime
  GROUP BY
       QW.[QueryTextId]
      ,QW.[SqlHandle]
      ,QW.[PlanHandle]
      ,QW.[StmOffsetStart]
      ,QW.[StmOffsetEnd]
   ,QW.[SourceId]
   ,QW.DatabaseNameId
ORDER BY [Total wait] DESC
Output example:
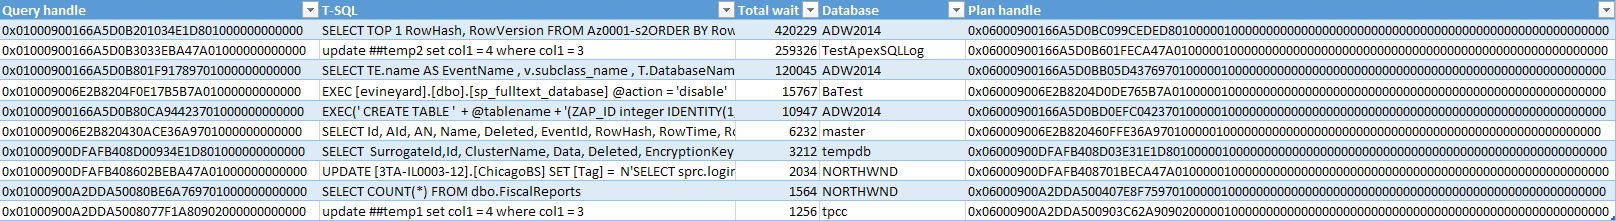
Top 10 queries with highest wait times per monitored database
Description: This report provides a view of the top 10 queries with the highest wait times in the selected database over the time.
The example below will show the top 10 queries with the highest wait time for January for a specified database
The .rdl file that accompany this report allows the user to select needed input parameters from the pre-populated drop-down lists
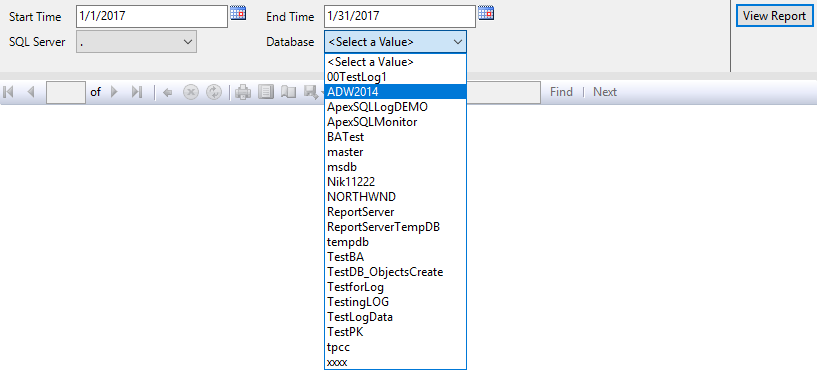
Inputs:
- Start date
- End date
- SQL Server name
- Database name
Definition:
-- Set the time range (this is just an example, and this part of query will be replaced when using in reporting application or SSRS with the parameters that will be feed directly from the application/SSRS)
---------------------------------------------------------------------
DECLARE @DatabaseId uniqueidentifier
DECLARE @SourceId uniqueidentifier
DECLARE @StartTime datetimeoffset(7)
DECLARE @EndTime datetimeoffset(7)

set @StartDate  = '2017-1-1 06:00:00.0000000 +01:00'
set @EndDate = '2017-1-21 06:00:00.0000000 +01:00'


SET @SourceId = [ApexSQL].[SourceNameToId] ('WIN-ECJIMF4DK6U')  -- Enter SQL Server name
SET @DatabaseId = [ApexSQL].[SourceNameToId] ('ASW2014') -- Enter the database name here

 -- Return Top 10 queries with highest wait time over the specified time period for the selected database
---------------------------------------------------------------------
SELECT TOP 10
       QW.[SqlHandle] as [Query handle]
	  ,MAX(QT.[SqlText]) as [T-SQL]
      ,SUM([WaitTime]) as [Total wait]
	  ,MAX(MD.[DatabaseName]) as [Database]
      ,QW.[PlanHandle] as [Plan handle]

  FROM [ApexSQLMonitor].[ApexSQL].[MonitorQueryWaits] QW
  LEFT JOIN ApexSQL.[MonitorQueryTexts]  QT ON QW.QueryTextId = QT.Id
  LEFT JOIN ApexSQL.[MonitorDatabases] MD ON QW.DatabaseNameId = MD.Id
  WHERE QW.DatabaseNameId = @DatabaseId
 AND [MeasuredAt] >= @StartTime
 AND [MeasuredAt]<= @EndTime
  GROUP BY
       QW.[QueryTextId]
      ,QW.[SqlHandle]
      ,QW.[PlanHandle]
      ,QW.[StmOffsetStart]
      ,QW.[StmOffsetEnd]
   ,QW.[SourceId]
   ,QW.DatabaseNameId
ORDER BY [Total wait] DESC
Output example:
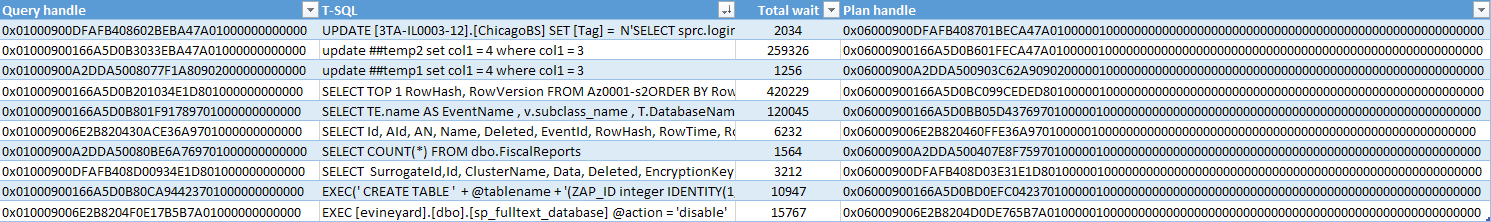
Top 10 queries with the highest wait time for a specific wait type per SQL Server
Description: This report provides information on the top 10 queries that accumulated the highest wait time for a specific wait type.
In a situation when high wait time values are detected for a specific wait type (i.e. ASYNC_NETWORK_IO, CXPACKET etc.) it is important to detect which particular queries associated with that particular wait type participated the most in generating such highest wait time values. This report should normally be the first step in troubleshooting when excessive wait times for a particular wait type are detected
The .rdl file that accompany this report allows the user to select needed input parameters from the pre-populated drop-down lists
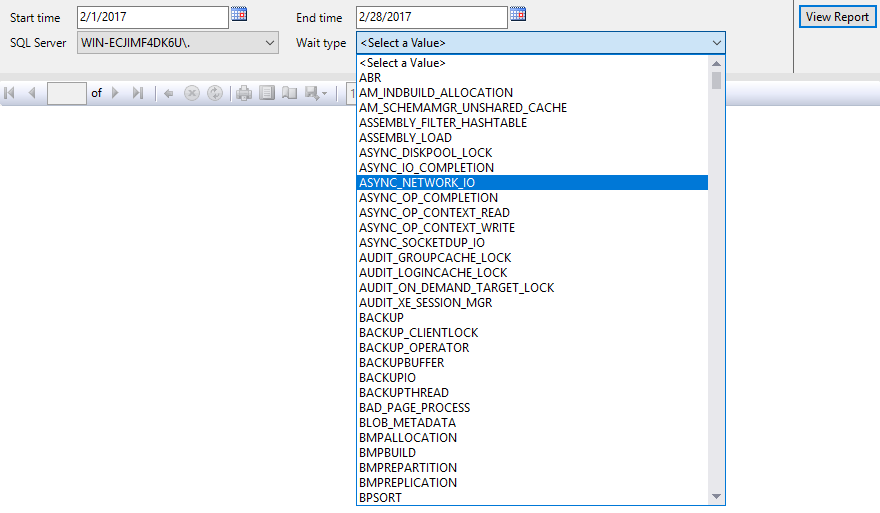
Inputs:
- Start date
- End date
- SQL Server name
- Wait stats type
Definition:
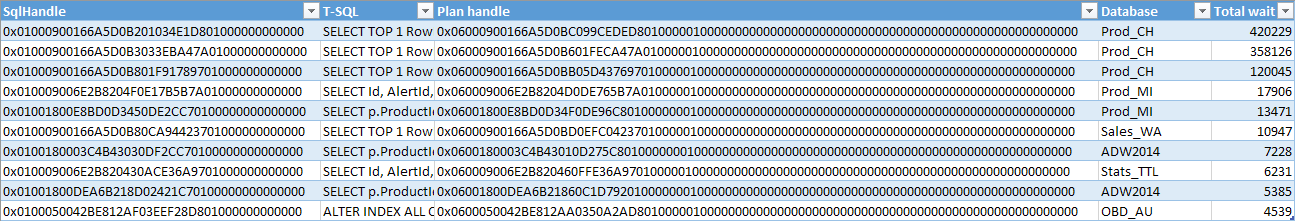
-- Set the time range (this is just an example, and this part of query will be replaced when using in reporting application or SSRS with the parameters that will be feed directly from the application/SSRS) --------------------------------------------------------------------- DECLARE @SourceId uniqueidentifier DECLARE @StartTime datetimeoffset(7) DECLARE @EndTime datetimeoffset(7) DECLARE @WaitType NVARCHAR(100) SET @SourceId = [ApexSQL].[SQLServerNameToId] ('WIN-ECJIMF4DK6U’) -- Enter SQL Server nameSET @StartTime = '2017-2-1 06:00:00.0000000 +01:00' SET @EndTime = '2017-2-28 06:00:00.0000000 +01:00' SET @WaitType = 'CXPACKET' -- Enter the Wait type name here SELECT TOP 10 QW.[SqlHandle] ,MAX(QT.SqlText) as [T-SQL] ,QW.[Plan handle] ,MAX(MD.DatabaseName) as [Database] ,SUM(QW.[WaitTime]) as [Total wait] FROM [ApexSQLMonitor].[ApexSQL].[MonitorQuerySingleWaitsView] QW LEFT JOIN ApexSQL.[MonitorQueryTexts] QT ON QW.QueryTextId = QT.Id LEFT JOIN ApexSQL.[MonitorDatabases] MD ON QW.DatabaseNameId = MD.Id WHERE WHERE WaitTypeName = @WaitType AND QT.SqlText IS NOT NULL AND [MeasuredAt] >= @StartTime AND [MeasuredAt]<= @EndTime GROUP BY QW.[QueryTextId] ,QW.[SqlHandle] ,QW.[Plan handle] ,QW.[StmOffsetStart] ,QW.[StmOffsetEnd] ,QW.[SourceId] ,QW.DatabaseNameId ,QW.[WaitTypeName] ORDER By [Total wait] DESC
Outputs:
Top 10 queries with highest wait time for a specific wait type per database
Description: This report should be generated in situations where the previous report indicates a potential issue with specific database(s). This report will allow better analysis of the specific wait type behavior at the database level, and thus a better understanding of the database performance issues
The .rdl file that accompany this report allows the user to select needed input parameters from the pre-populated drop-down lists
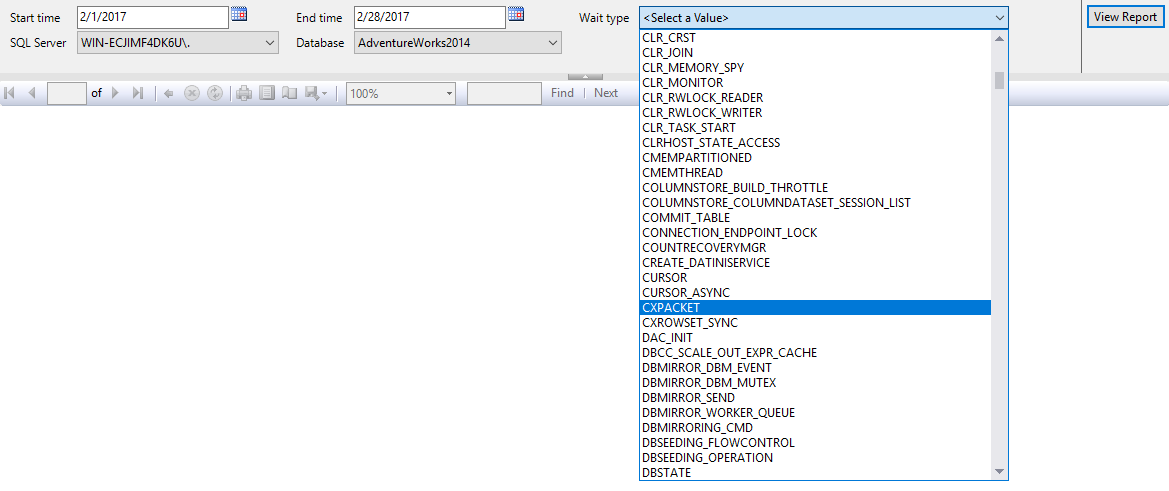
Inputs:
- Start date
- End date
- SQL Server name
- Database name
- Wait stats type
Definition:
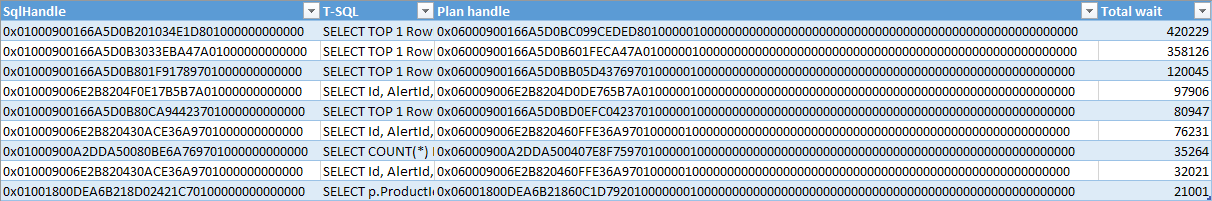
-- Set the time range (this is just an example, and this part of query will be replaced when using in reporting application or SSRS with the parameters that will be feed directly from the application/SSRS)
---------------------------------------------------------------------
DECLARE @DatabaseId uniqueidentifier
DECLARE @SourceId uniqueidentifier
DECLARE @StartTime datetimeoffset(7)
DECLARE @EndTime datetimeoffset(7)
DECLARE @WaitType NVARCHAR(100)

SET @SourceId = [ApexSQL].[ServerNameToId] ('WIN-ECJIMF4DK6U')  -- Enter SQL Server name
SET @DatabaseId = [ApexSQL].[SourceNameToId] ('ADW2014') -- Enter the database name here
SET @StartTime = '2017-2-1 06:00:00.0000000 +01:00'
SET @EndTime = '2017-3-5 06:00:00.0000000 +01:00'
SET @WaitType = 'CXPACKET' -- Enter the Wait type name here

SELECT TOP 10
	 QW.[SqlHandle]
	,MAX(QT.SqlText) as [T-SQL]
	,QW.[PlanHandle] as [Plan handle]
	,SUM(QW.[WaitTime]) as [Total wait]
  FROM [ApexSQLMonitor].[ApexSQL].[MonitorQuerySingleWaitsView] QW
  LEFT JOIN ApexSQL.[MonitorQueryTexts]  QT ON QW.QueryTextId = QT.Id
  LEFT JOIN ApexSQL.[MonitorDatabases] MD ON QW.DatabaseNameId = MD.Id
WHERE QW.SourceId = @SourceId AND WaitTypeName = @WaitType AND QT.SqlText IS NOT NULL AND QW.DatabaseNameId = @DatabaseId AND [MeasuredAt] >= @StartTime AND [MeasuredAt]<= @EndTime
  GROUP BY
    QW.[QueryTextId]
      ,QW.[SqlHandle]
      ,QW.[PlanHandle]
      ,QW.[StmOffsetStart]
      ,QW.[StmOffsetEnd]
   ,QW.[SourceId]
   ,QW.DatabaseNameId
   ,QW.[WaitTypeName]
   ORDER By [Total wait] DESC
Outputs:
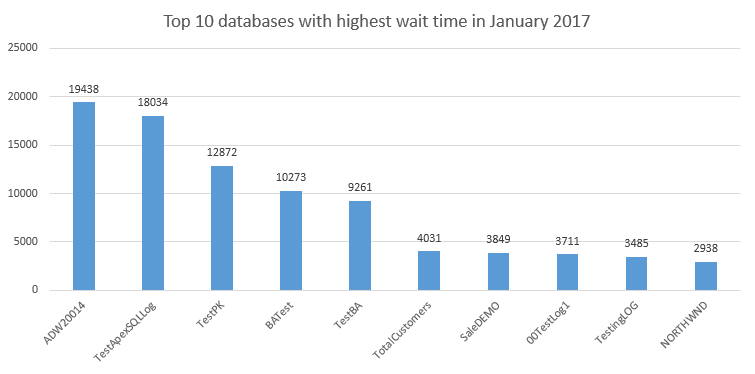
Top 10 databases with the highest wait time
Description: This report lists the top 10 databases hosted by a specified SQL Server where the highest wait times are accumulated during the specified period of time. By using this report, it is possible to get information about what databases are the most affected and thus to prioritize those to be troubleshooted first when SQL Server performance problem is detected
The .rdl file that is associated with this report allows customization by allowing the user to select needed input parameters from the pre-populated drop-down lists

Inputs:
- Start date
- End date
- SQL Server name
Definition:
--WARNING! ERRORS ENCOUNTERED DURING SQL PARSING!
-- Set the time range (this is just an example, and this part of query will be replaced when using in reporting application or SSRS with the parameters that will be feed directly from the application/SSRS) --------------------------------------------------------------------- DECLARE @SourceId uniqueidentifier DECLARE @StartTime datetimeoffset(7) DECLARE @EndTime datetimeoffset(7) SET @SourceId = [ApexSQL].[SQLServerNameToId] ('WIN-ECJIMF4DK6U’) -- Enter SQL Server nameSET @StartTime = '2017-2-1 06:00:00.0000000 +01:00' SET @EndTime = '2017-2-28 06:00:00.0000000 +01:00' -- Top 10 databases with highest wait time SELECT TOP 10 MAX(MD.[DatabaseName]) as [Database] ,SUM([WaitTime]) as [TotalWait] FROM [ApexSQL].[MonitorQueryWaits] QW LEFT JOIN ApexSQL.[MonitorDatabases] MD ON QW.DatabaseNameId = MD.Id WHERE QW.SourceId = @SourceId AND QW.MeasuredAt > @StartTime AND QW.MeasuredAt < @EndTime GROUP BY [DatabaseNameId] ORDER BY [TotalWait] DESC GO
Outputs:
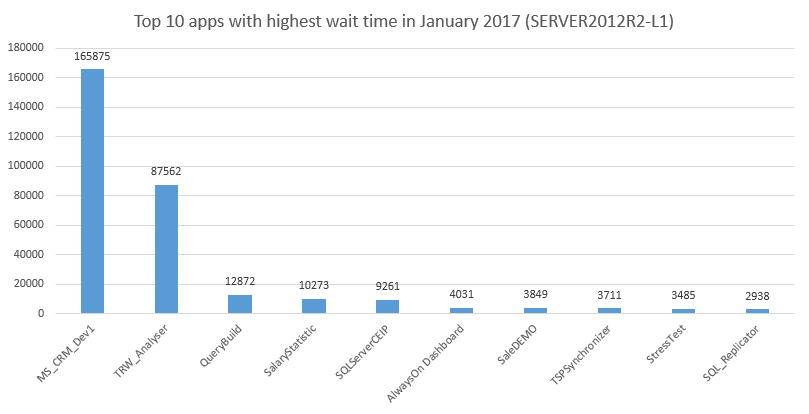
Top 10 applications with the highest wait times on SQL Server
Description: This is an important report for DBAs when reviewing SQL Server performance issues, since the report can provide information about what applications caused the highest waits on SQL Server for a specific period of time.
This report is also accompanied with the .rdl report file that allows customization of the input parameters
Inputs:
- Start date
- End date
- SQL Server name
Definition:
-- Set the time range (this is just an example, and this part of query will be replaced when using in reporting application or SSRS with the parameters that will be feed directly from the application/SSRS) --------------------------------------------------------------------- DECLARE @SourceId uniqueidentifier DECLARE @StartTime datetimeoffset(7) DECLARE @EndTime datetimeoffset(7) SET @SourceId = [ApexSQL].[SQLServerNameToId] ('<SQL Server name>’) -- Enter SQL Server nameSET @StartTime = '2017-2-1 06:00:00.0000000 +01:00' SET @EndTime = '2017-2-28 06:00:00.0000000 +01:00' -- Top 10 wait types with the highest wait time as percent of total wait time on specified SQL Server SELECT Top 10 LI.Name as [Application], SUM (WaitTime) as [Wait time] FROM [ApexSQLMonitor].[ApexSQL].[MonitorQueryWaits] QW LEFT JOIN [ApexSQLMonitor].[ApexSQL].[MonitorQueryLookupInfo] LI ON LI.Id = QW.ApplicationNameId WHERE Li.Type = 3 AND QW.SourceId = @SourceId GROUP BY LI.Name ORDER by [Wait time] DESC
Outputs:
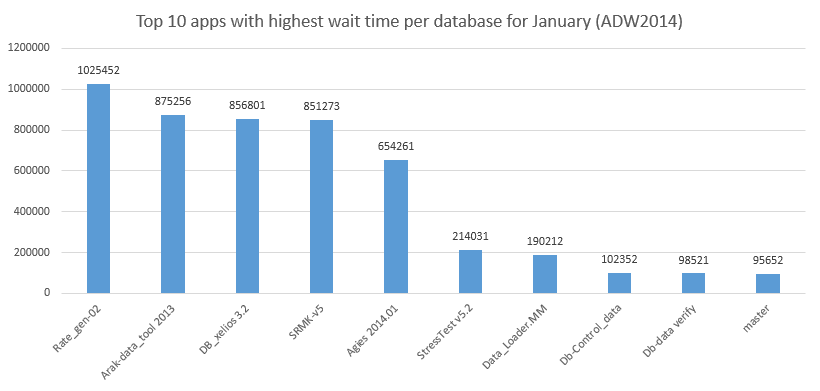
Top 10 applications with highest wait times in a database
Description: Similar to the previous example, this report provides more detailed insight in the influence of applications on the performance of a specific database. This is sort a report that will not be regularly created for all databases, but rather on an ad hoc basis for databases that are affected by performance issues.
.rdl file is provided and it allows customization via user-selectable input parameters

Inputs:
- Start date
- End date
- SQL Server name
Definition:
--WARNING! ERRORS ENCOUNTERED DURING SQL PARSING!
-- Set the time range (this is just an example, and this part of query will be replaced when using in reporting application or SSRS with the parameters that will be feed directly from the application/SSRS) --------------------------------------------------------------------- DECLARE @SourceId uniqueidentifier DECLARE @DatabaseId uniqueidentifier DECLARE @StartTime datetimeoffset(7) DECLARE @EndTime datetimeoffset(7) SET @SourceId = [ApexSQL].[SQLServerNameToId] ('<SQL Server name>’) -- Enter SQL Server nameSET @DatabaseId = [ApexSQL].[SourceNameToId] ('ASW2014') -- Enter the database name here SET @StartTime = '2017-2-1 06:00:00.0000000 +01:00' SET @EndTime = '2017-2-28 06:00:00.0000000 +01:00' -- Top 10 wait types with the highest wait time as percent of total wait time on specified SQL Server SELECT Top 10 LI.Name as [Application], SUM (WaitTime) as [Wait time] FROM [ApexSQLMonitor].[ApexSQL].[MonitorQueryWaits] QW LEFT JOIN [ApexSQLMonitor].[ApexSQL].[MonitorQueryLookupInfo] LI ON LI.Id = QW.ApplicationNameId WHERE Li.Type = 3 AND QW.SourceId = @SourceId AND QW.DatabaseNameId = @DatabaseId GROUP BY LI.Name ORDER by [Wait time] DESC
Outputs:
Top 10 wait types as percent of the total wait time on SQL Server
Description: This is a statistical report that can provide closer insight into wait types with high wait times.
This particular report provides information about the top 10 wait types but as a percent of total wait times on SQL Server.

Inputs:
- Start date
- End date
- SQL Server name
Definition:
-- Set the time range (this is just an example, and this part of query will be replaced when using in reporting application or SSRS with the parameters that will be feed directly from the application/SSRS)
---------------------------------------------------------------------
DECLARE @SourceId uniqueidentifier
DECLARE @StartTime datetimeoffset(7)
DECLARE @EndTime datetimeoffset(7)


SET @SourceId = [ApexSQL].[ServerNameToId] ('WIN-ECJIMF4DK6U')  -- Enter SQL Server name
SET @StartTime = '2017-01-20 15:53:14.2662215 +01:00';
SET @EndTime = '2017-02-28 15:53:14.2662215 +01:00';

-- Top 10 wait types with the highest wait time as percent of total wait time on specified SQL Server

WITH cte
     AS (SELECT WaitTypeId,
                ( [Value] * 100 ) / SUM([Value]) OVER (PARTITION BY 1)
                AS   PercentOfTotalWait
         FROM   [ApexSQL].[FGetWaitstatsCumulative] (
   @SourceId,
  @StartTime,
  @EndTime,
  60*24*365))
SELECT TOP 10 WT.WaitTypeName,  [PercentOfTotalWait]
FROM   cte LEFT JOIN [ApexSQL].[MonitorWaitTypes] WT on WT.Id = WaitTypeId
ORDER BY [PercentOfTotalWait] desc
Outputs:

Downloads
Please download the script(s) associated with this article on our GitHub repository
Please contact us for any problems or questions with the scripts.
All articles in this series:
- How to create custom SQL Server performance reports – Part 1 (Performance and status metrics)
- How to create custom SQL Server performance reports – Part 2 (alerts, Indexes and databases)
- How to create custom SQL Server performance reports – Part 3 (Wait statistics and Query waits)


