


Applies to
ApexSQL Defrag, ApexSQL Monitor
Summary
This article provides information about reviewing and monitoring SQL Server index size with ApexSQL Defrag and ApexSQL Monitor.
ApexSQL Defrag
Index size reviewing methods in ApexSQL Defrag
Being mainly utilized as the SQL Server indexes defragmentation tool, users also can use ApexSQL Defrag to manually track index size and their cumulative size at the SQL Server instance, database and/or table level.
There are two methods to achieve that:
- Customize and filter the main grid in the application and, optionally, work with raw data in Excel spreadsheet
- Generate pre-defined reports with exact information related to total indexes size
Manually track SQL Server index size
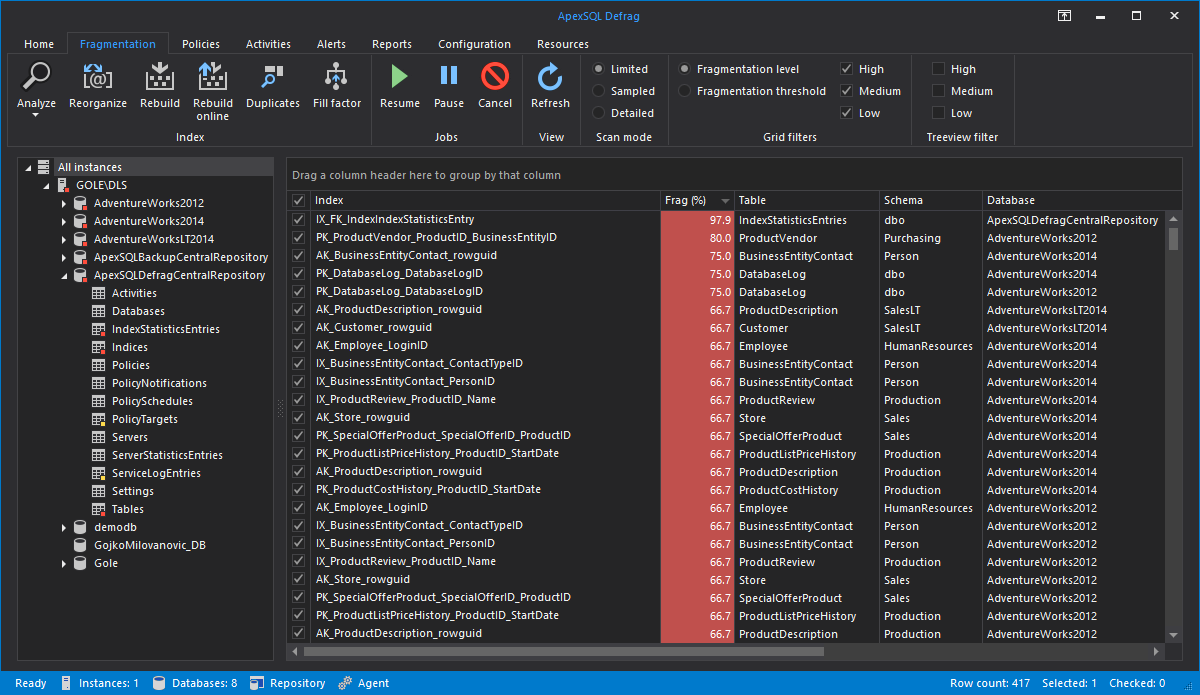
After starting ApexSQL Defrag, if a SQL Server instance has been added previously, the main grid will appear, showing various information like names of indexes, from which table indexes are, type of indexes, and focus of this article, index size (marked below):
Now, to filter the needed data, we will group indexes by three columns: Instance, Database and Table, and leave rest of the columns in grid intact.
|
Quick tip:
Data shown in the main grid depends on the selection in the server explorer, since it provides drill-down from indexes from all included instances to the single index. For example, if three instances are present, and All instances are chosen, all indexes from all three instances will be shown in the grid. |
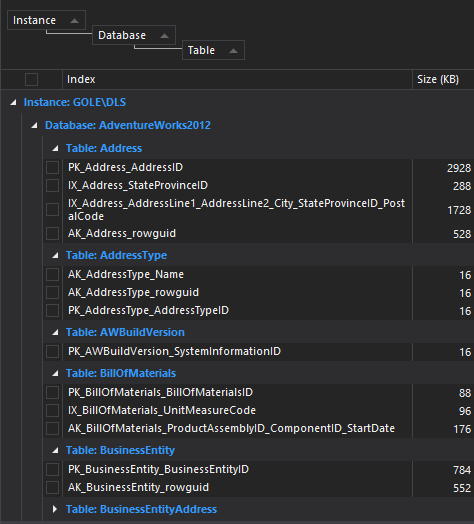
After this customization, the main grid will look like this, providing detailed view on indexes, their fragmentation and their size:
|
Quick info: To group by a column, drag a column header into gray field above the grid or right-click and choose Group by this column option. |
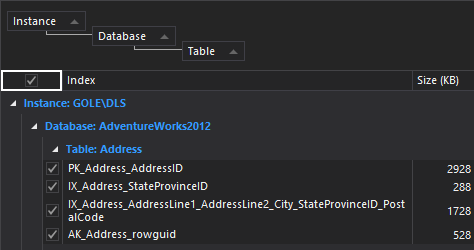
To copy present information from the grid, preserving grouping and sort order, paste it into Excel spreadsheet, customize it and save as a report.
To do that, select all items in the grid and then copy selected rows using Ctrl + C keys.
Note that copied data will be pasted in a raw form into Excel spreadsheet, and it needs to be slightly customized, which depends on user’s needs. In the example above, the grid shows data from two SQL Server instances.
This is one example how list of indexes along with their sizes can look after customization:
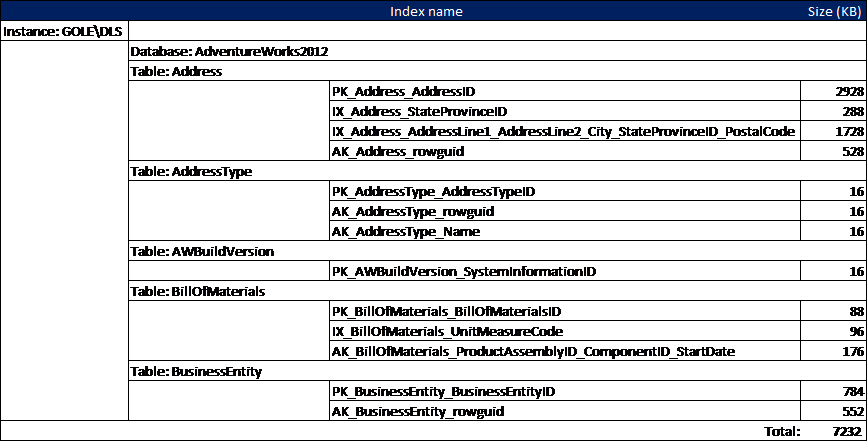
Additionally, add SUM() function at the bottom of the Size (KB) column to calculate the total size of indexes (showing as a Total value in the screenshot above).
Review total index size with pre-defined reports
An alternative to see the cumulative size of indexes, go to Reports tab, and click Total button:
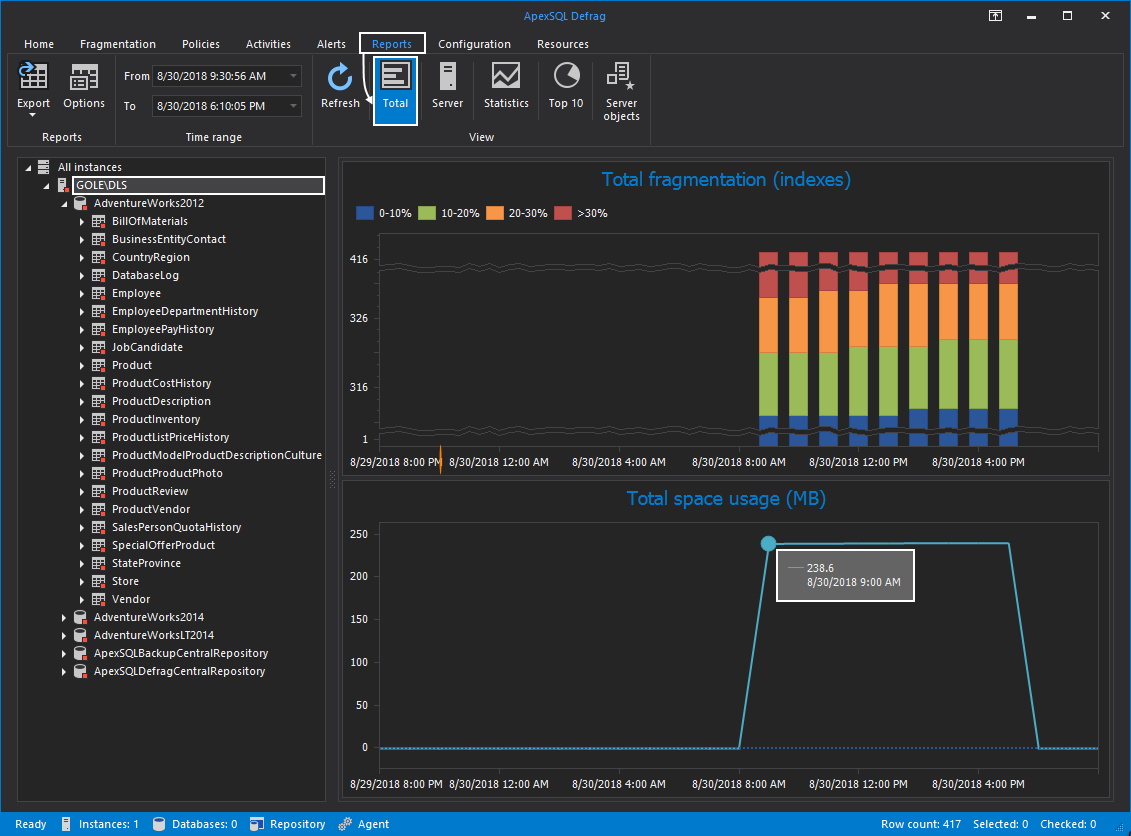
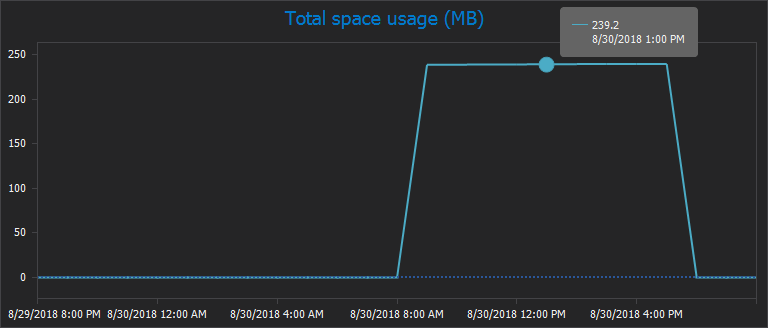
By hovering points in the displayed Total space usage (MB) chart at the bottom, it is possible to see the exact total index size and how it has changed, in a historical context:
In the example above, we generated the report for the specified SQL Server instance.
ApexSQL Monitor
Monitor SQL Server total size of indexes in a database with the custom metric
Besides system, SQL Server and database performance, ApexSQL Monitor extensively monitors indexes on a desired SQL server instance with built-in performance counters related to index monitoring, like Average fragmentation (%), User scan, User seek and other, which are out of the scope of this article.
Although ApexSQL Monitor doesn’t incorporate a performance counter which will track total size of indexes in a particular database, this is possible to achieve with using the custom metric feature.
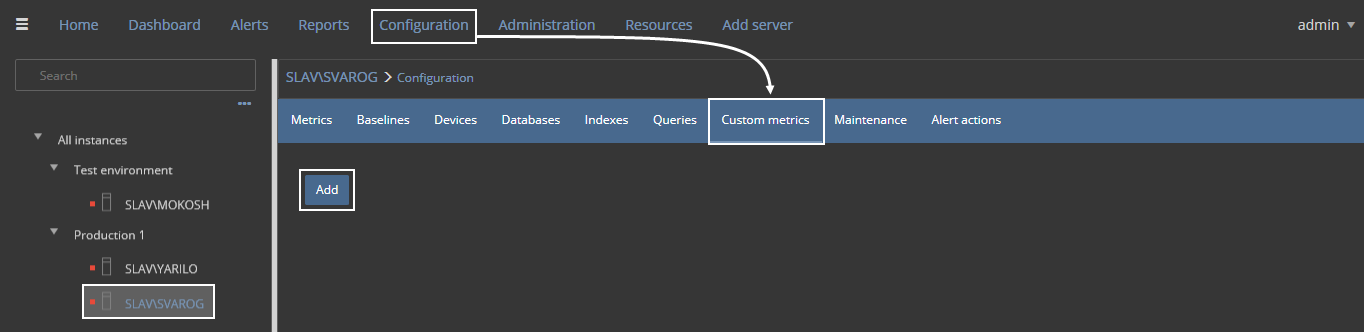
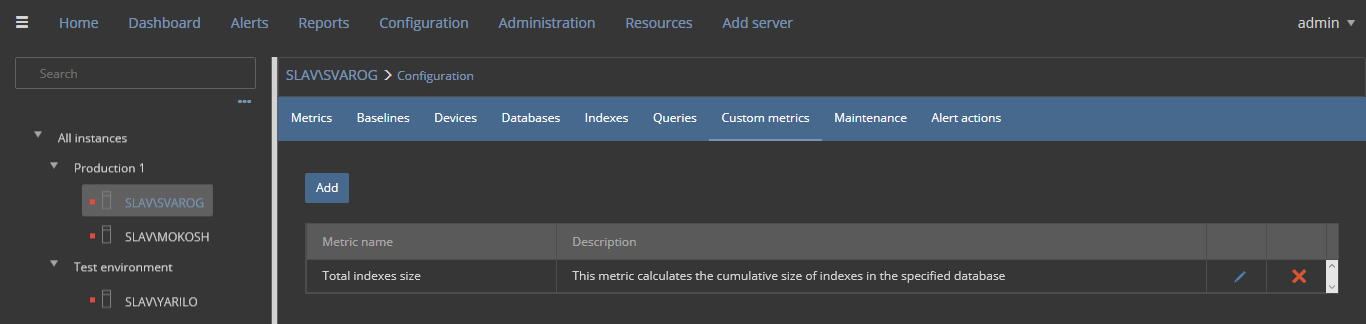
Choose a desired SQL Server instance, go to the Configuration subsystem, Custom metrics tab, and click Add button to create custom metric:
|
Quick tip:
To create the same custom metric for all monitored SQL Server instances, select All instances group in the Tree view, instead of a single SQL Server. The principle of creating the custom metric is the same. |
The Add custom metric view will appear. Input the following information:
| Field | Input |
| Name | Total indexes size |
| Description | This metric calculates the cumulative size of indexes in the specified database |
| Unit | KB |
| Category | Database performance |
| Query text |
USE %Database% SELECT SUM(sz.[used_page_count]) * 8 FROM sys.dm_db_partition_stats AS sz INNER JOIN sys.indexes AS ix ON sz.[object_id] = ix.[object_id] AND sz.[index_id] = ix.[index_id] INNER JOIN sys.tables tn ON tn.OBJECT_ID = ix.object_id |
| Period | 60s |
| Metric return type | Execution |
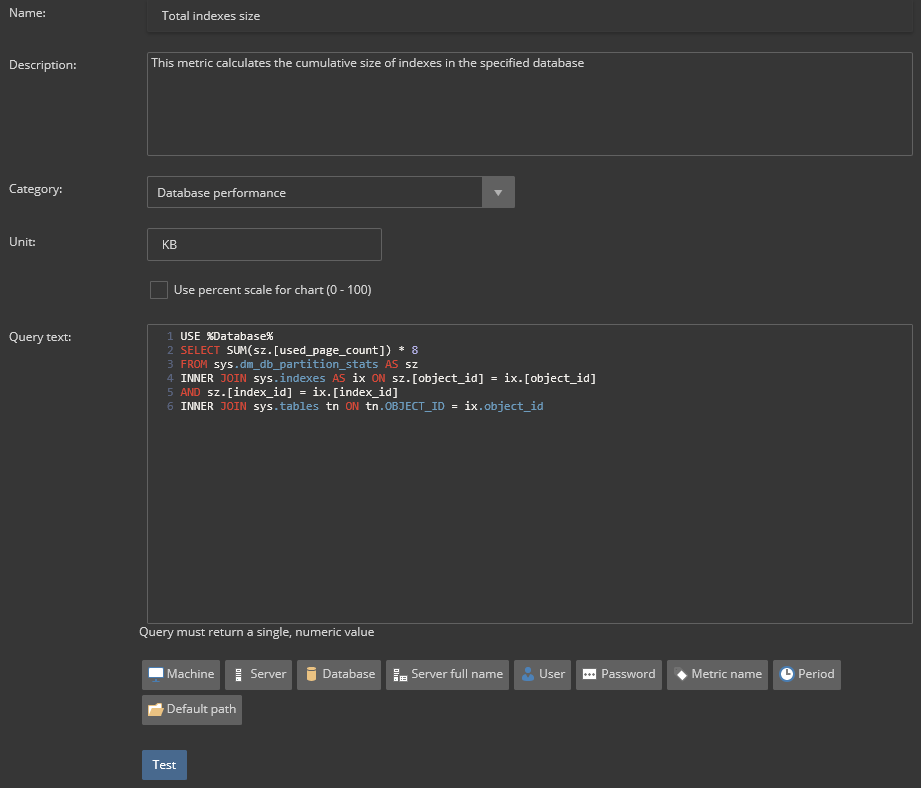
To validate this metric, test it, and it should return single numeric value. After validation, save the metric.
The custom metric will appear like this in Custom metrics view:
The Total index size (KB) metric can be configured for alerting in Configuration subsystem, Metrics view, by setting thresholds, the monitoring period and the alert period, as well.
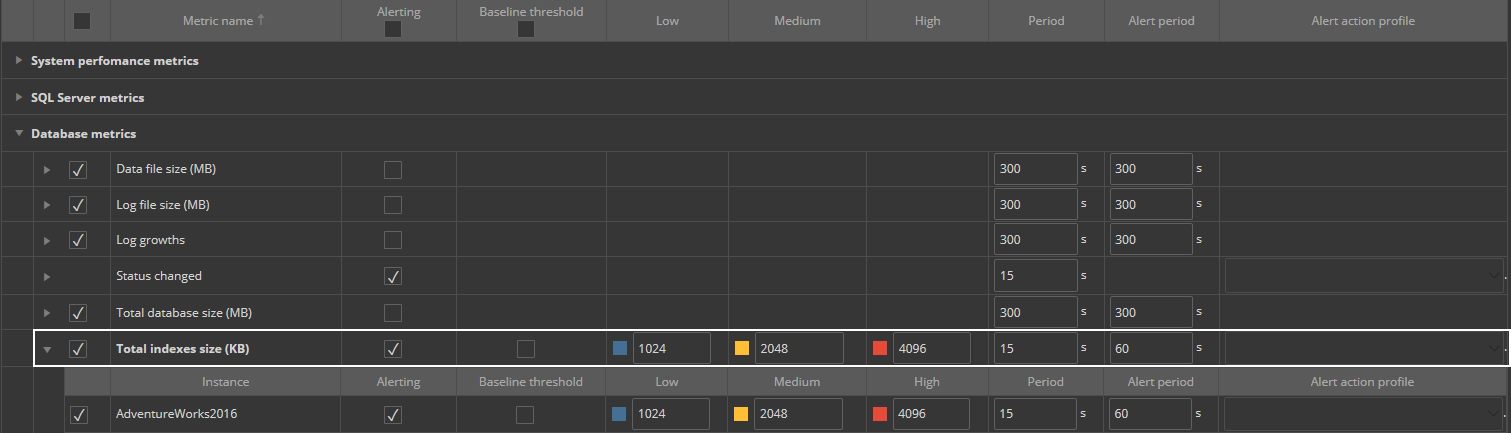
In this case, we will set thresholds to 1024 KB (low), 2048 KB (medium), and 4096 KB (high), with monitoring period of 15s, and alert period of the 60s. These values are provisory, and they should be adjusted to user’s needs and requirements.
Besides the Configuration view, Total index size (KB) metric will appear in Database panel in the Server Dashboard, for each of the monitored database:
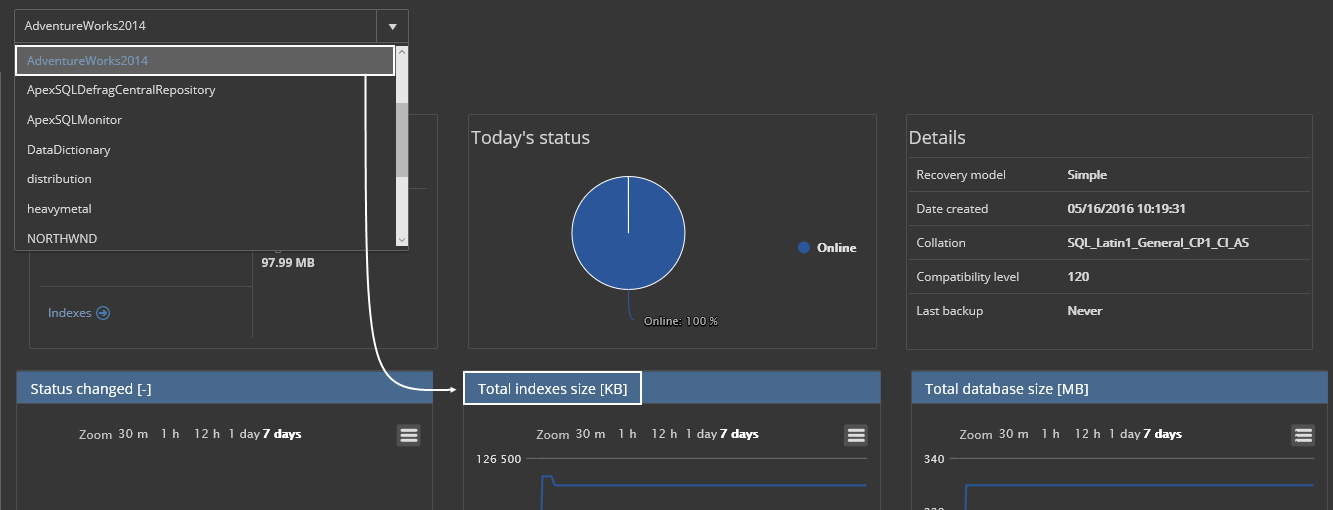
As it can be seen in the chart above, there are no any significant change in total index size during the time in the AdventureWorks2014 database.
Additionally, the chart for this metric can be embedded in the custom report (database chart or bar report item), if needed.
Automate the monitoring of SQL Server indexes size
In order to be proactively alerted on critical values of this metric, user can create an email profile and a corresponding alert action.


