What is SQL Server Activity monitor?
Where can I see Activity monitor data?
How frequently are the Activity monitor charts refreshing in the Instance dashboard?
How can I access more detailed information about the current SQL Server activity?
How is the activity monitor data classified?
Can I see those data for a specific database of interest?
What is the SQL Server Activity monitor?
The ApexSQL Monitor activity monitor is a real-time monitoring feature that displays SQL Server processes related performance data to help to understand the impact of these processes on the monitored SQL Server instance. It combines real-time SQL Server performance data collected from various parts of SQL Server and presents it in a graphical and tabular form for easier and faster review and understanding.
Where can I see Activity monitor data?
In ApexSQL Monitor, the instance dashboard is the first stop where activity monitor data is presented in three charts: Waiting Tasks, Database I/O [MB/s], Batch requests/sec.
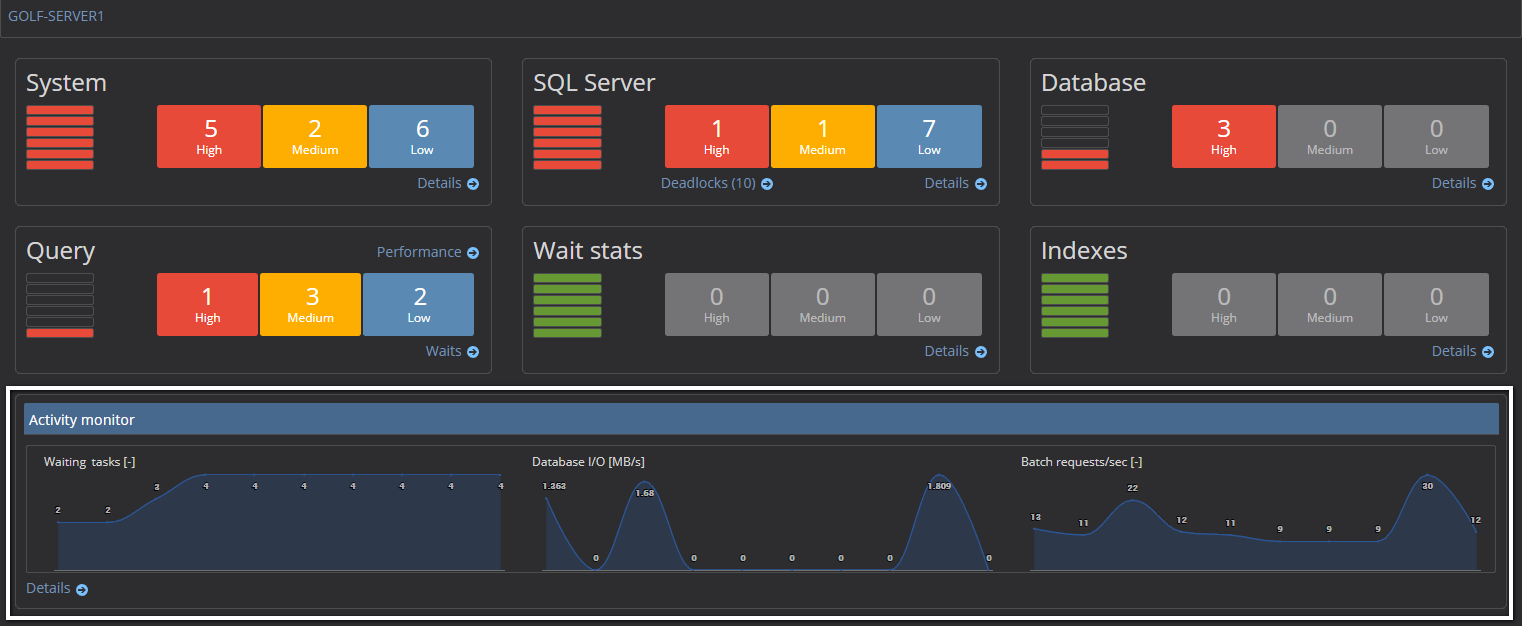
- Waiting tasks – the chart displays the number of SQL Server tasks that are currently waiting for various resources such as CPU, memory or I/O
- Database I/O – Displays the current transfer rate when database engine reads/writes data blocks from disk into memory, from memory to a disk or from disk to disk. It is measured in Megabytes/second.
- Batch Requests/sec – The metric reflects the SQL Server performance by displaying the number of SQL Server batches that the monitored SQL Server instance receives in one second. For more information read SQL Server performance counters (Batch Requests/sec or Transactions/sec): what to monitor and why
How frequently are the Activity monitor charts refreshing in the Instance dashboard?
The charts read and display the data from the monitored instance every five seconds. The chart refresh rate is fixed and cannot be changed by the user.
How can I access more detailed information about the current SQL Server activity?
While the instance dashboard displays the 3 most essential Activity monitor performance charts, for detailed activity monitor data, open the dedicated Activity monitoring page via Details link in the Activity monitor section of the instance dashboard.
How is the activity monitor data classified?
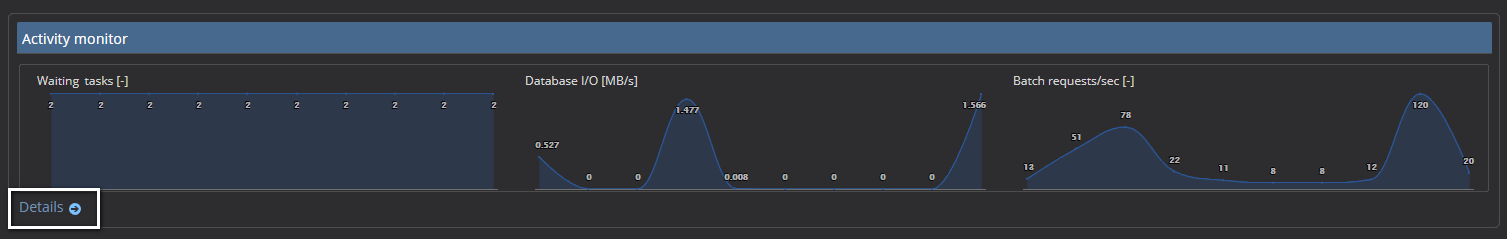
The Activity monitor page is organized in the three main performance sections: Processes, Active expensive queries, and Resource waits.
Processes – the section displays a list of all active processes that are connected and executing on the monitored SQL Server instance. The following data is displayed directly in the associated table:
- Session ID – It is a unique number assigned to every new process when it made a connection to SQL Server
- Wait time (ms) – displays the time in milliseconds that the particular process is waiting for one or more resources. When the process is not in the state of waiting for resources the wait time displays the 0 as a value
- Wait type – the current or the last wait type that the particular process is forced to waits for
- Blocked by – in case that another process blocks the monitored process, the Session ID of that blocking process displays here. In case that blocking doesn’t exist, the N/A is displayed
- Blocker – in situations where the blocking chain exists, the session that is the head blocker for the blocking chain is displayed here. In case the actual monitoring process is the head blocker for other processes, the field displays the value of 1
- Total CPU (ms) – a time in milliseconds that the process has spent on the CPU during the execution
- Total physical I/O (MB) – the amount of data in megabytes that the process uses for operations of reading from, and writing to a physical disk
- Memory use (KB) – displays the amount of memory measured in kilobytes that are being used by the process during the execution
- State – indicates the state of the process. If the process is in the runnable or sleep state, the state will be marked as N/A. In other cases, the state can have one of the following values: Running, Suspended, or Background
- Command – indicates the SQL command used by the process at the moment of monitoring. It can be any SQL command such as Insert, Delete, Select, Waitfor, to mention just a few
Additional monitored process details are available by expanding the process details using the expand button left of the Session Id number, which expands the table row and displays the Details tab.
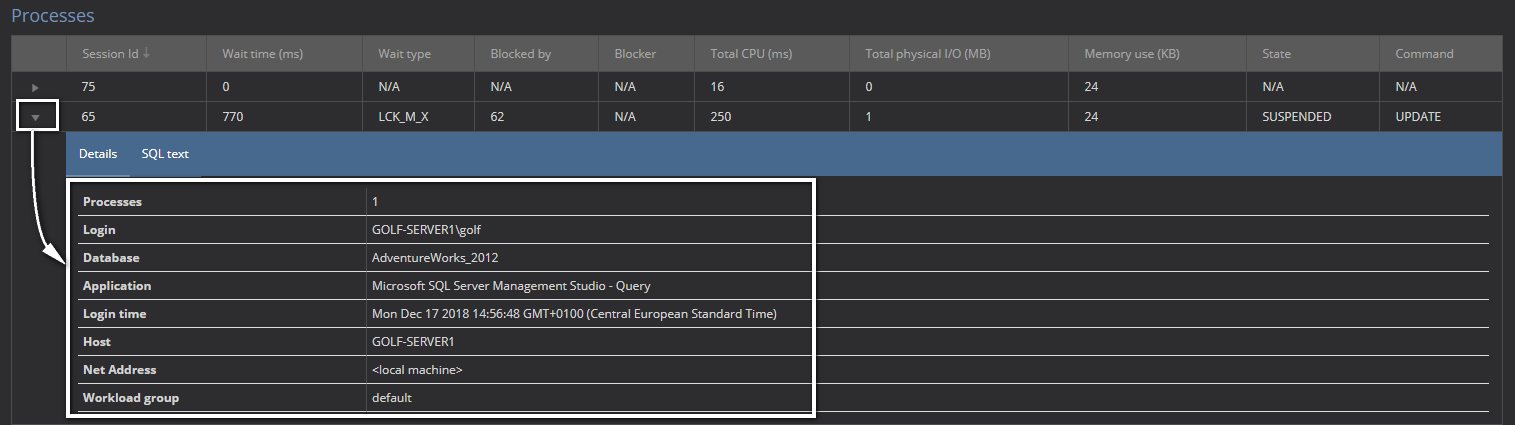
A few of the items are described below:
- Login – The name of the SQL Server login used to run that monitored process
- Login time – indicates the time and date when the particular user that is used to run the monitored process is logged in. It doesn’t necessarily indicate the time and date when the process is started
- Host – displays the name of the machine (computer) from where the connection to SQL Server is made
- Net address – the unique identifier assigned to the network interface card on the host machine. When the user logs in the Net address is assigned, and it combines MAC and IP with the port number that should ensure that required results are directed to the correct connection
- Workload group – displays the workload group name of the Resource governor, assigned to the session that hosts the monitored process
Active expensive queries
This session display queries that perform poorly in the monitored instance.
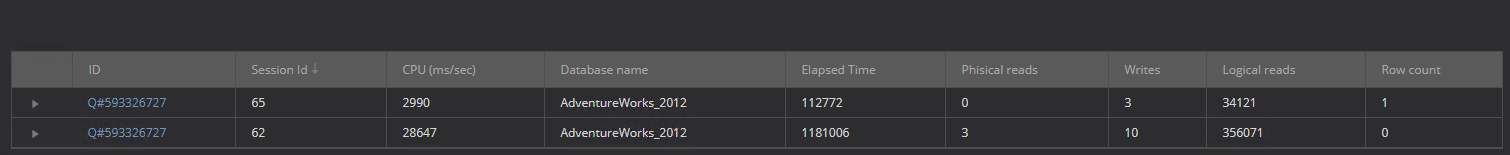
While some of the data displayed are already explained in the Processes section, some of the information unique to the Active expensive queries section are:
- Elapsed time – the time in milliseconds that the query accumulated during its execution
- Physical reads/sec – the number of physical reads that the query performs in one second. Indicates at which rate the query performs reads from the disk
- Physical writes/sec – the number of physical writes that the query performs in one second. Indicates at which rate the query performs writes to the disk
- Logical reads/sec – the number of logical reads that the query performs in one second. Indicates at which rate the query reads from the SQL Server database
- Row count – the number of rows involved/processed by the query during the execution
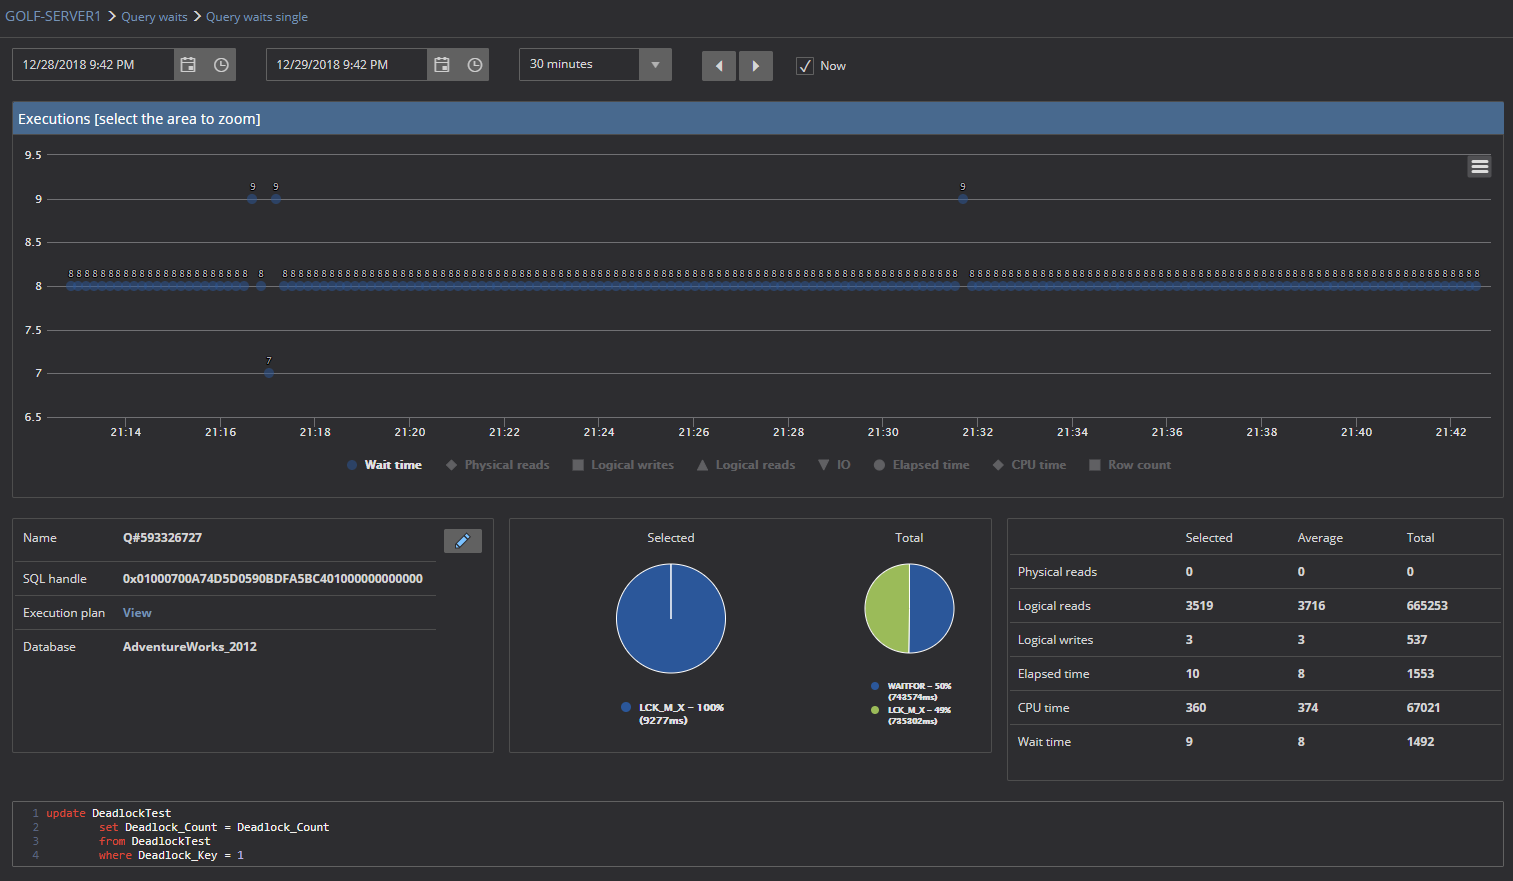
To research in more detail, the queries that appear in the Active expensive queries section can drill down to the Single query waits page via the link in the query name in the ID column.
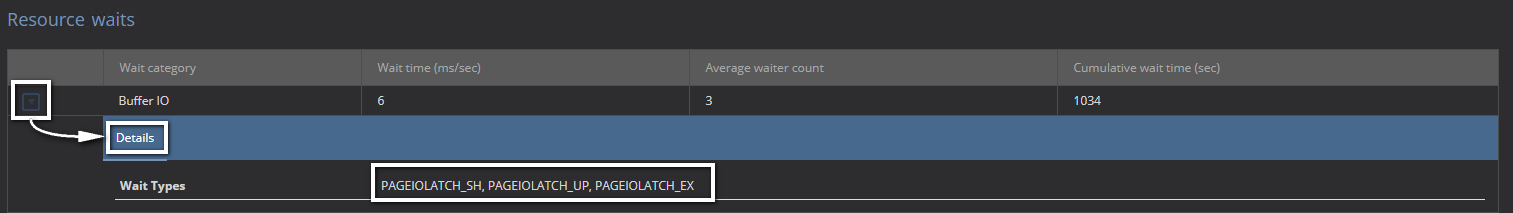
Resource waits
This section provides essential information regarding the wait times in SQL Server about the key SQL Server performance-related resources like CPU, I/O, memory, network, etc.
- Wait category – displays the wait statistic categories in which the various related wait types are logically organized.
- Wait time (ms/sec) – the wait time measured in milliseconds per second display the wait time that all processes on monitored SQL Server that are waiting for resources of the specified wait category. It is the rate of the waiting in SQL Server at one second in the interval between the two updates
- Average waiter count – the number of processes that are is state of waiting for resources that belong to that wait category, measured at a specific moment of sampling the data from the SQL Server
- Cumulative wait time (sec) – the total wait time in seconds that was accumulated for a specific wait category since the last SQL Server start
Additional Resource waits details are available by expanding the wait category details via the expand button left of the Wait category name. That expands the table row and displays the Details tab where all Wait types of that wait category with accumulated wait time are listed.
Can I see those data for a specific database of interest?
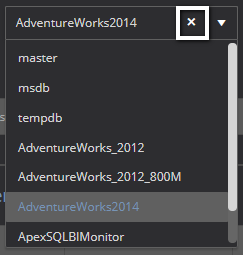
Yes. In situations where the specific database has to be tracked and analyzed, the Activity monitor allows you to filter the displayed data so that activity can be displayed only for a selected database. To do that at the top of the page next to the Refresh button, expand the Select database drop-down menu and select the database to display the performance data for.
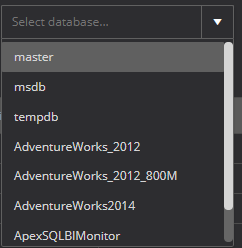
The data will be displayed for the selected database only until the user changes the database. To display data for the whole SQL Server again, use the “x” in the drop-down menu to remove the selected database.