Applies to
ApexSQL Monitor
Summary
This article explains how to use ApexSQL Monitor to investigation the SQL Server wait statistics, as well as what data related to wait statistic it collects, how and how those data should be interpreted and used in the analysis of the SQL Server performance monitoring.
Description
The article will address the following questions:
- What is a SQL Server Wait statistic?
- What is the difference between Wait statistics and Query waits?
- What Wait types I can monitor?
- Do I have to monitor all wait types?
- Why are some wait types not monitored by default?
- Can I configure what wait types to monitor, or to exclude from monitoring?
- When disabled, will wait types not be monitored at the database or SQL Server level?
- Does the application store the wait stats data?
- How can I view the collected wait stats data?
- What will wait type data be displayed in the Wait stats page?
- Can I drill in the chart to see more precise data?
- How frequently are wait stats data collected? Can I change the interval and/or can I turn off Wait statistic collection entirely??
- Can I calculate the baseline for the wait stats data and can I see how the wait type relates to calculated baseline?
- Can I set alerting for Wait stats?
- Can I print or save as a file the Wait stats chart?
What is a SQL Server Wait statistic?
Every SQL query that is executed against the SQL Server has to wait during its execution. Theoretically, it is possible to execute a query without waiting, but that never occurs in the real world. To be able to track what the query waits for, SQL Server has implemented a mechanism to track and log all states where the query is waiting for something, including the information about the reasons why a query is forced to wait. The information that SQL Servers collect about the reasons a query has to wait during its execution is the so-called Wait statistic.
- The waits in SQL Server occurs due to external and internal reasons. External reasons are called Resource Waits, while internal reasons are called Cooperative Scheduling Waits.
- A Resource Wait occurs when execution is forced to wait on external resources, such as reading the locked data from the table, waiting on the buffer pool to become available or physical or logical storage during I/O operations are just some of the examples.
- A Cooperative Scheduling Wait occurs due to working mechanisms of SQLOS (SQL Server Operating System). To maximize the SQL Server efficiency, SQLOS does not use preemptive Windows scheduling, but instead, it schedules the threads by itself. SQLOS Scheduler (sometimes called SOS Scheduler) decides when the query will be executed on CPU, for how long and when it will be taken off the CPU to allow to another query to executes. The time an SQL Query can be actively executed on CPU is set to 4ms by SQLOS Scheduler and that 4ms time slice is the so-called Quantum. It is exactly this SQLOS Scheduler mechanism which is an integral part of SQL Server is the reason why the query has to always wait in practice during the execution.
It is important to understand that, when it comes to Wait statistics, that although we look to provide the precise information on symptoms and reasons of the waits, that can be further used by the DBA for analysis and determining of the root causes, but wait statistics, in and of themselves does not pinpoint the actual root causes.
What is the difference between Wait statistics and Query waits?
While both deal with wait statistics, the primary difference between the Wait statistic feature and the Query waits feature is that Wait stats deal with Wait statistics globally at the SQL Server level, while Query waits deal with Wait statistic at an individual query level.
Wait stats provide the break down over the time of various wait types that occurs on SQL Server. They allow insights into the wait types that are source of what SQL Server is waiting on during query execution and at what level various wait types affect the SQL Server work.
What Wait types I can monitor?
ApexSQL Monitor is capable of tracking all Wait types. The number of wait types that can be monitored depends only on the version of SQL Server that is monitored and what wait types that particular version supports.
Do I have to monitor all wait types?
No. While ApexSQL Monitor is capable of tracking all Wait types, by default, it tracks the most important ones to prevent collecting and storing unwanted data.
Why are some wait types not monitored by default?
Not all Wait types are equal. There are some wait types that predominate in the real-world work with SQL Server, and those wait types are the cause of almost all problems. Furthermore, tracking the wait types that wouldn’t be helpful in performance troubleshooting or that are even not related to performance troubleshooting would increase the noise, making focusing on the real problem to be a challenging job. Therefore, to prevent collecting, storing and processing of less important or unnecessary wait types, ApexSQL Monitor tracks by default only the important wait types from the SQL Server performance troubleshooting standpoint.
Can I configure what wait types to monitor, or to exclude from monitoring?
Yes. While ApexSQL Monitor tracks the predefined number of important Wait types, it still allows you to retain the full control on what Wait types you might want to turn on or turn off for monitoring.
To configure what wait types, you want to monitor:
-
Open the Configuration page using the Configure link in the main menu

-
Select the Wait types tab

-
It will open the list of the Wait types that ApexSQL monitor tracks
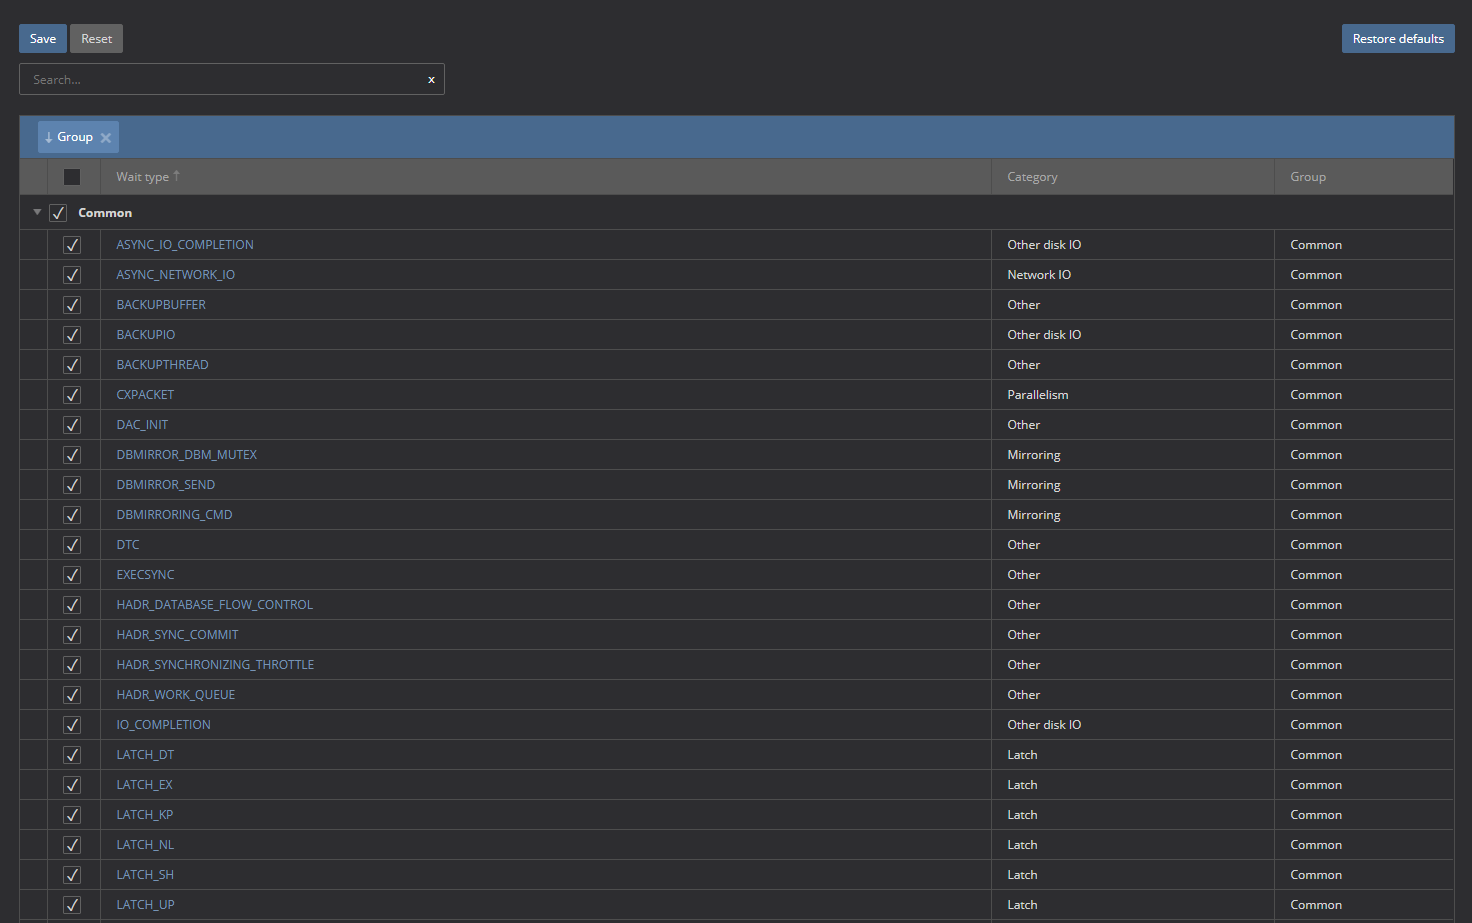
All wait types are split into two groups: Common and Other.
The Common group contains all Wait types that ApexSQL Monitor tracks by default and they are all selected. The Other group contains the rest of the Wait types and wait types contained within this group are not monitored by default.

The wait types are listed in alphabetical order within the groups, and for each wait type listed, the associated performance category that it belongs to is displayed in the Category column.
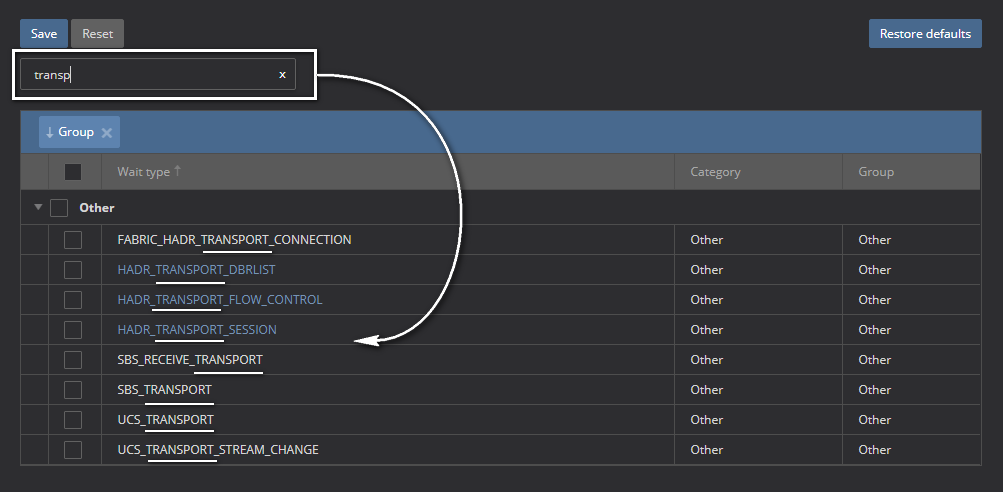
Since there are over 900 wait types that SQL Server tracks and that can be listed on this page, the appropriate “live” search filter is included for easy and fast locating of needed wait type. The results will start to appear as soon as you start to type into the search box.

The filter works using the “contain” condition, so it is enough to type in any known part of the wait type name, and it will list all wait types that contain the types string as part of the name.
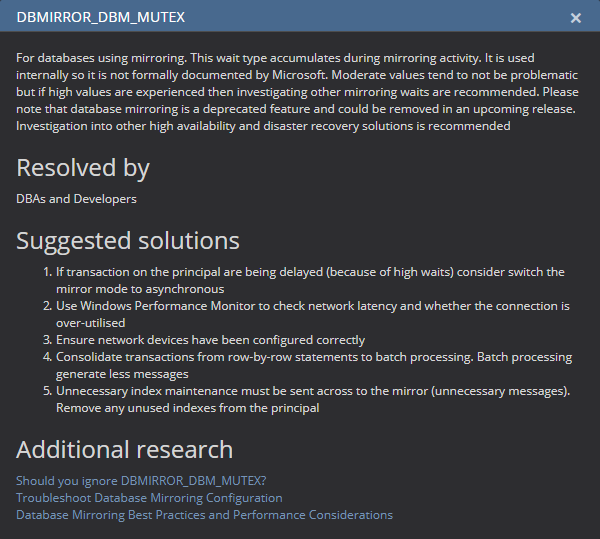
For those that need more information about a specific wait type, suggested solutions for the issue caused by that wait type and additional links to the more detailed article for gaining a more in-depth knowledge, just click on the name of the wait type, and the appropriate helper dialog will pop up.
Once the wait types are configured press the Save button, and the current settings are saved.
In case that there is a need to restore all changes to a factory setting, press the Restore defaults button.
When disabled, will wait types not be monitored at the database or SQL Server level?
When disabled, the application will not catch that wait type at all, including the queries that are waiting for that wait type. The only exception is when the query accumulated the excluded wait type alongside with some other wait type during the execution. In that case, the wait type will be collected as part of that query to provide full information about that particular query execution. If the excluded wait type is the sole wait type accumulated during the query execution, the query will not be collected at all.
Besides the above case, when the wait type is collected as the part of the individual query execution, it will not be collected or processed anyhow in all other scenarios, and therefore it will not be stored in the repository database or displayed in the Wait stats page.
Does the application store the wait stats data?
Yes. All data regarding the wait types are stored in the repository database. That allows historical research and analysis of the collected data.
How can I see the collected wait stats?
To view the collected wait stats data:
-
Select the SQL Server in the server explorer or select the server name in the server pane from the main dashboard

- That opens the Instance dashboard page
-
Select Details in the Waits stats section of the instance dashboard
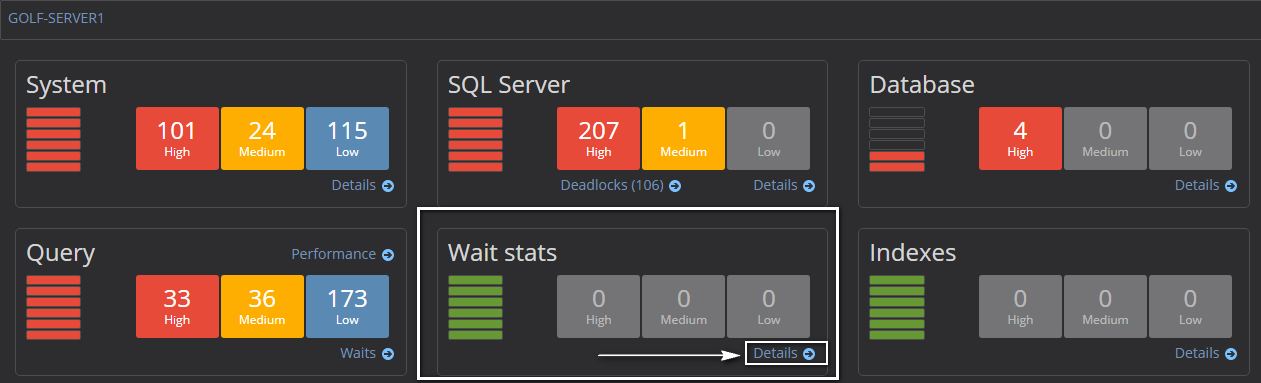
-
The Wait stats page is now displayed

What will wait type data be displayed in the Wait stats page?
The Wait stats page is divided into three related segments, where each displays the different aspects of the collected wait statistic. Each of those segments serves to provide more comprehensive information and help to gain better perception and understanding of potential issues and where the issue might be.
The page contains the Wait stats chart, the Wait stats by top 5 categories pie chart and the Wait stats table where wait types are listed per specific category, they belong to and the precise wait time accumulated for each wait type.
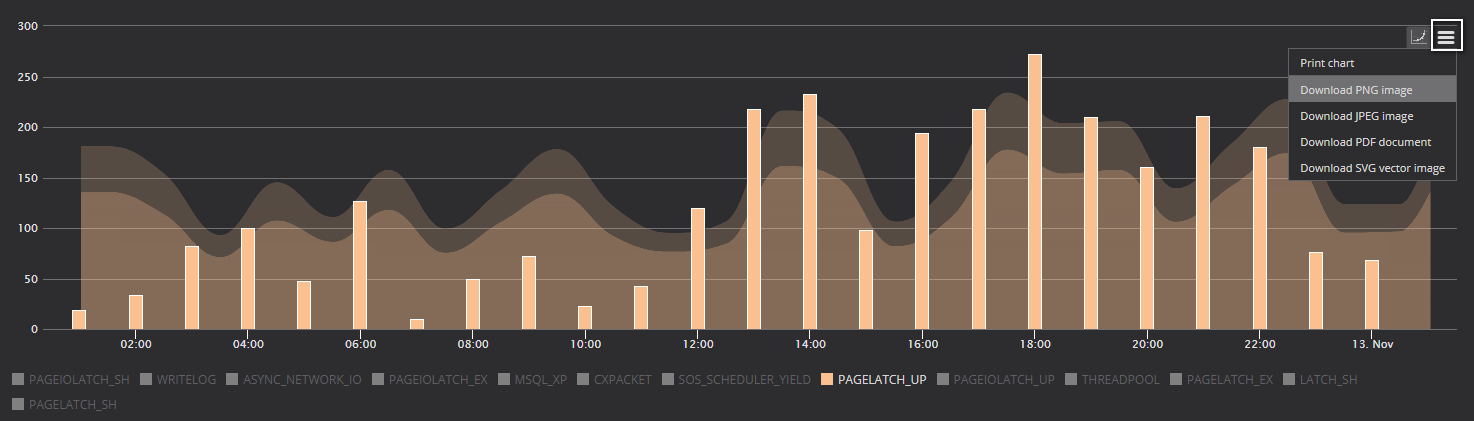
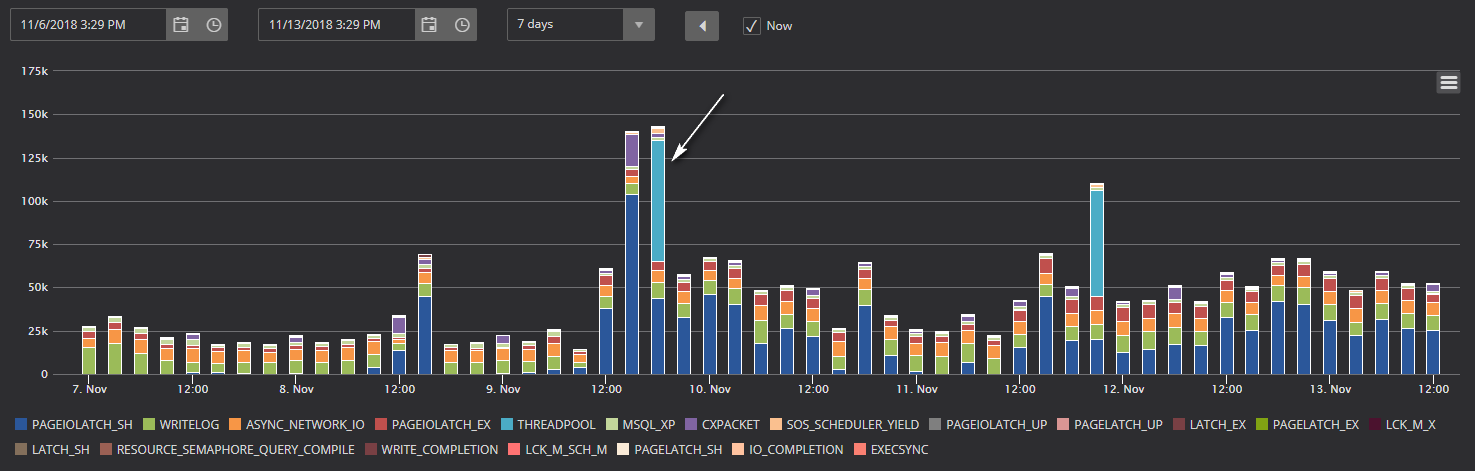
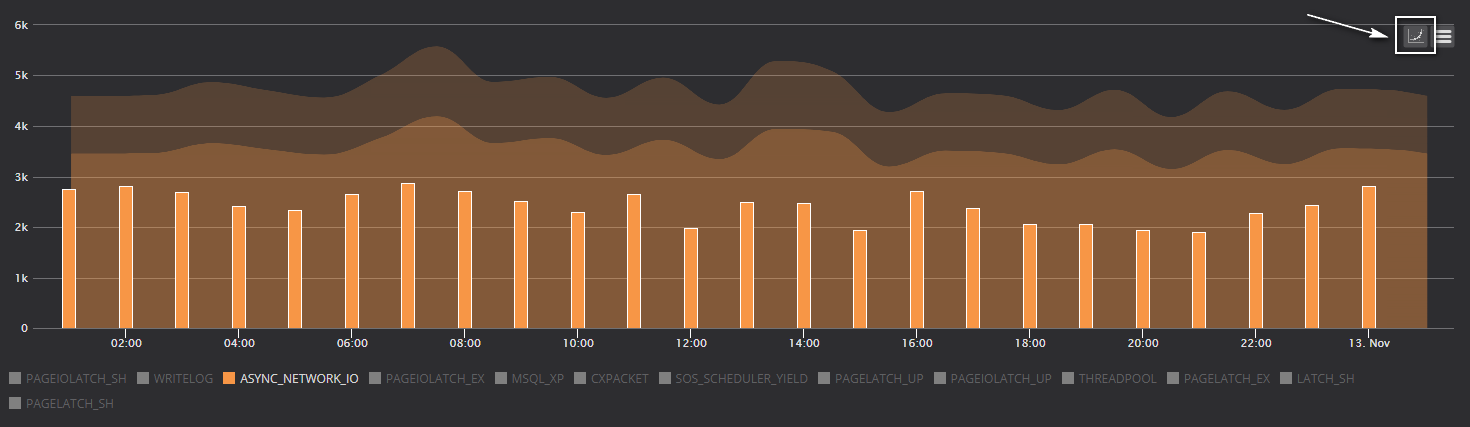
Wait stats chart – The chart displays the top 20 wait types that are accumulated the highest wait time over the period specified by the user. The names of the top 20 wait stats listed in the chart’s legend are displayed in descending order based on Wait stats time each wait type accumulated in the given period of time. That means that Wait stats with the highest accumulated wait time are listed first.
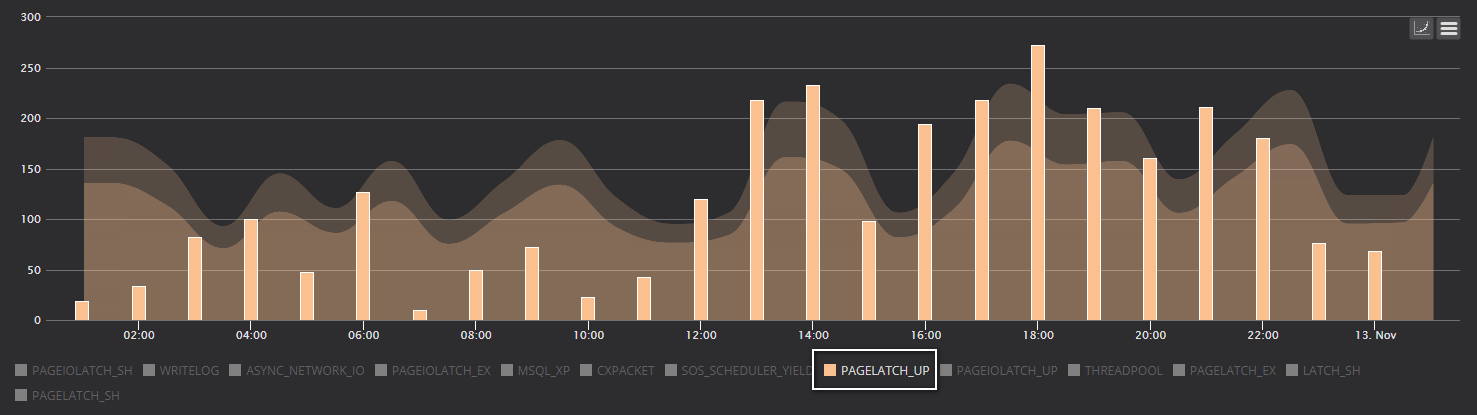
For those who want to inspect the wait types in more detail, the chart provides the option to turn off specific wait types from being displayed in the chart. If needed, the user can leave just one wait type for analysis and troubleshooting. By clicking on the name of the wait type in the chart legend, it can be turned on or off in the chart.
Below is an example of how that looks like when wait types are excluded partially and how when a single one is retained for display in the chart.
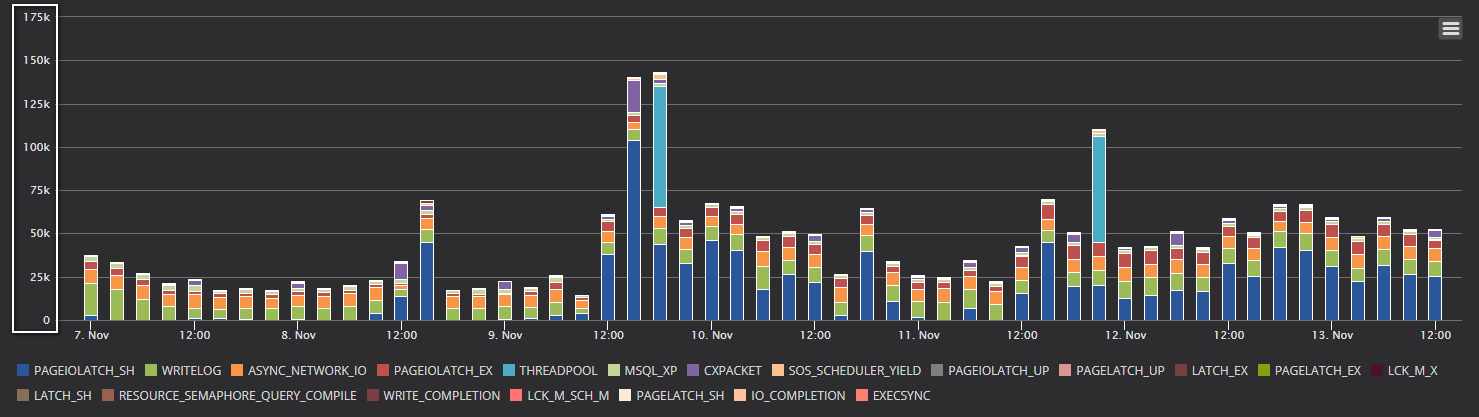
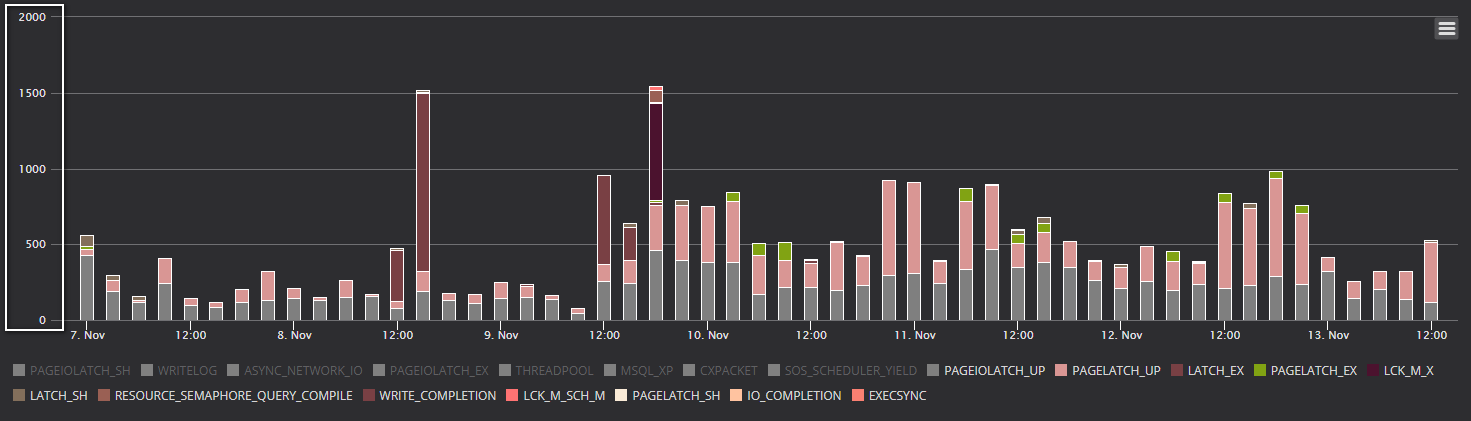
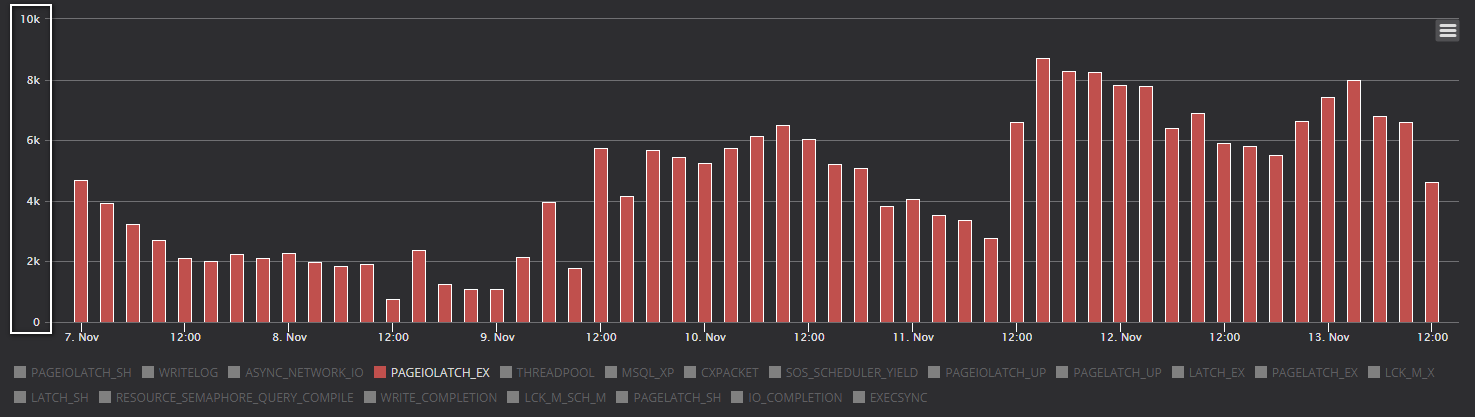
|
Quick tip: The scale of the Y-axis of the chart will be scaled dynamically depending on the selected wait types to ensure the better preview of displayed wait types. |
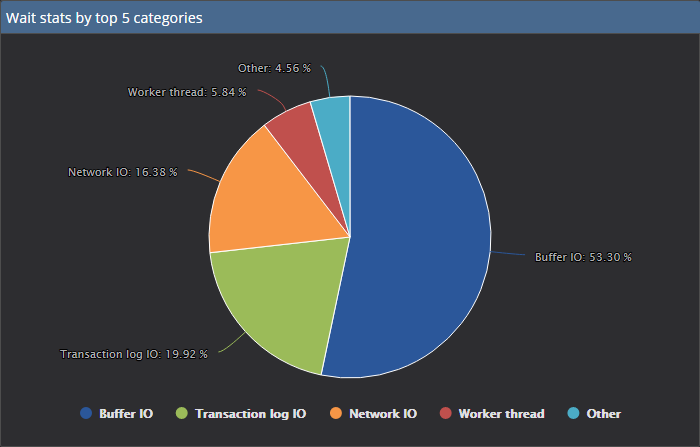
Wait stats by top 5 categories pie chart – Displays the ratio between the accumulated wait time on the server among the top 5 wait categories with highest wait time accumulated.
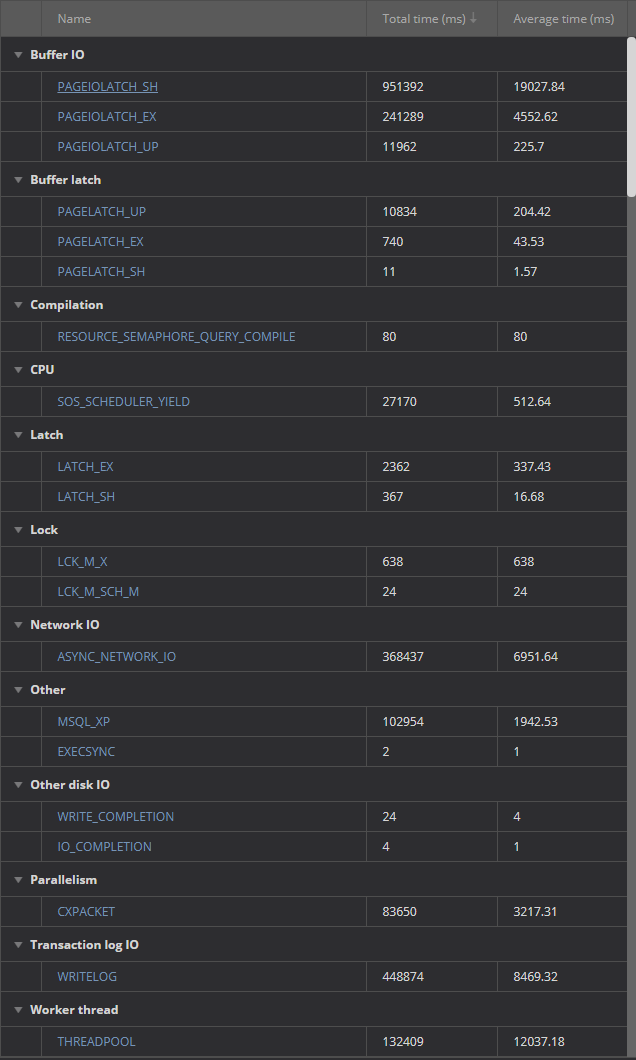
Wait stats table – Displays the total accumulated wait time for wait types over a specified period as well as the average wait time.
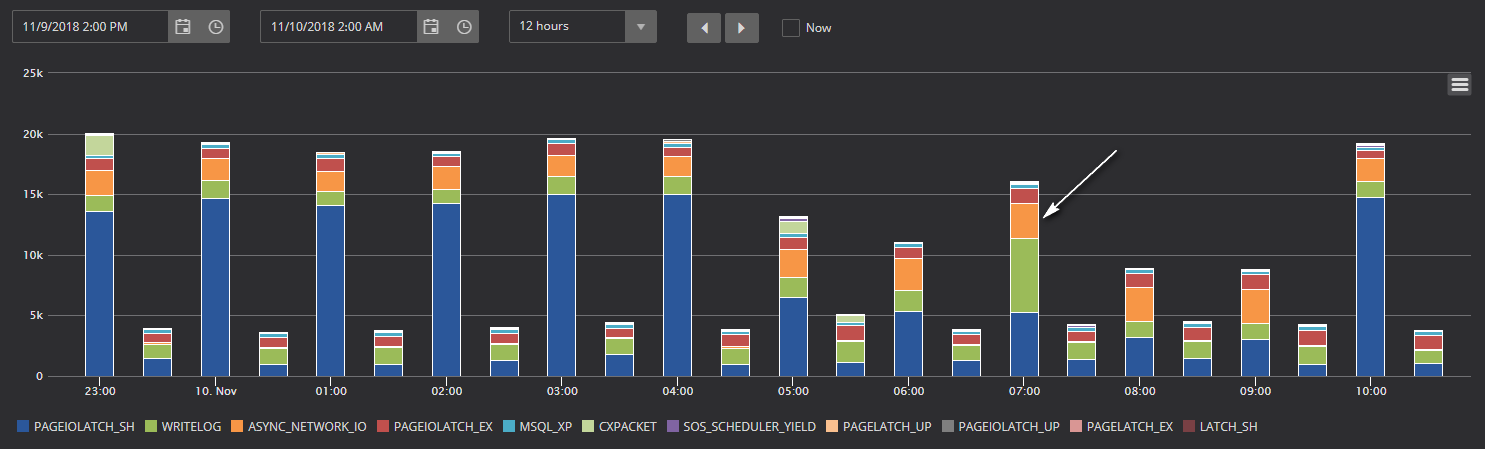
Can I drill in the chart to see more precise data?
Yes. Just click on the specific bar, and the chart will be scaled down to display the shorter period of time for data contained within that bar. Drilling down in the chart allows you to see data with a more detailed view, broken down across a shorter period of time, down to 30 minutes.

How frequently are wait stats data collected? Can I change the interval and/or can I turn off Wait statistic collection entirely?
By default, ApexSQL Monitor collects the wait stats data in 30 minutes’ interval. The collecting frequency is configurable in the SQL Server section of the Metrics configuration page.
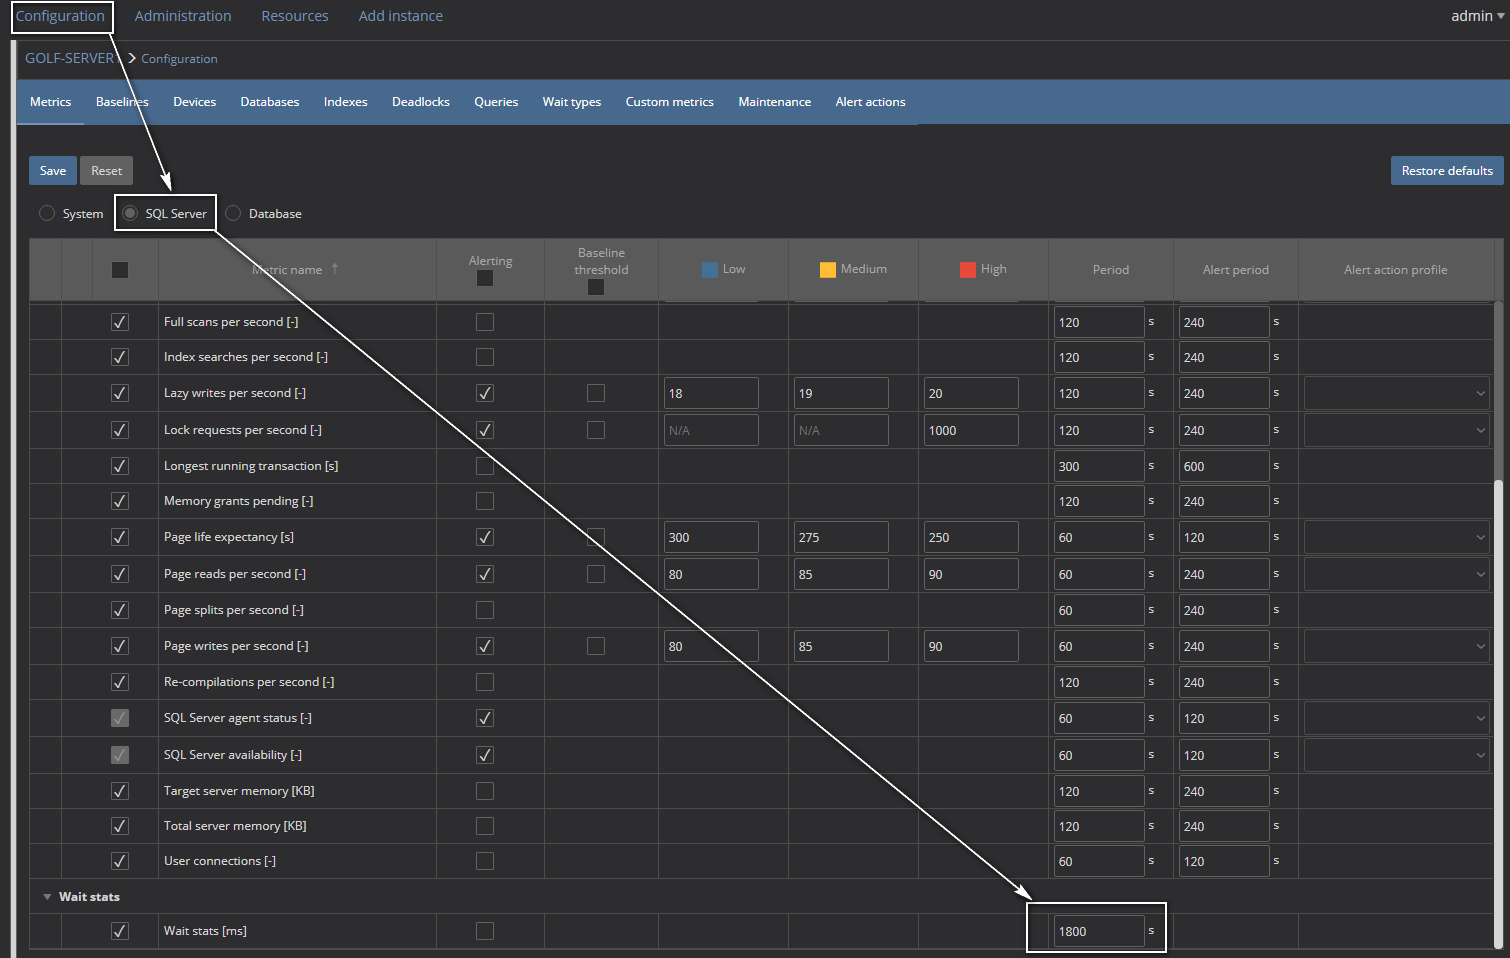
To turn off Wait statistic monitoring, just uncheck the checkbox next to the Wait stats [ms]. Each configuration change made here must be saved using the Save button.
Can I calculate the baseline for the wait stats data and can I see how the wait type relates to calculated baseline?
Yes. the baseline can be calculated for Wait stats data based on the historical data. Calculating baseline requires at least 7 days of data to be collected. ApexSQL Monitor calculates the baseline for each collected wait type independently. That allows the wait stats data to be tracked via baseline per individual wait type.
To turn on/off displaying the baseline for wait types in the chart, click on the baseline icon in the top right part of the chart.
To check the baseline for different wait types, just click on the name of the wait type in the legend of the chart.
Can I set alerting for Wait stats?
Yes. Just check the Alerting checkbox for the Wait stats [ms] and set the appropriate values for the low, medium and high thresholds.

The threshold time is defined per individual wait type. So, what that means in practice? When the data are collected on 30 minutes, if in the example, 5 wait types have a wait time that is higher than some of the predefined thresholds, the appropriate alert will be triggered for each of those five wait types. Therefore, the alerting system is not based on the global wait time accumulated, but rather granularly on every wait type for its time accumulated between the two reading periods.
|
Quick tip: It is highly advisable to turn on alerting based on the calculated baseline. This is the most reliable method for alerting for wait statistic. For most wait types, using baseline-based alerting is the only recommended alerting method, as due to hardly predictable nature of wait types, baselining is the closest to what could be considered a valid alerting and the way to prevent massive false positive and false negative alerting that could occur as a consequence of manually defined thresholds. Use manually defined thresholds in exceptional cases only, when specific troubleshooting is required, and switch back to the baseline-based alerting as soon as possible. |
Can I print or save as a file the Wait stats chart?
Yes. use the hamburger button in the top left corner of the chart and select from the menu whether you want to print the chart or save it in PNG, JPEG image format, PDF document format or SVG vector-based drawing file format.