


The Query waits feature is the core ApexSQL Monitor feature and, in most cases, the first step in resolving SQL Server performance issues. Query wait statistics, somewhere referred to as the Response Time Analysis (RTA), is for many less experienced or new DBAs the most complicated part of performance troubleshooting. ApexSQL Monitor’s query wait feature is designed to provide fast and easy insight in the query performance data and thus providing a significant help in identifying the causes of the SQL Server performance issues.
Here we will provide detailed answers to the most common questions and doubts related to the ApexSQL monitor query waits feature
- Why use query waits information when traditional performance metrics are available?
- Why is query waits information essential and how it helps in to resolve SQL Server performance issues?
- How can I access the Query waits feature in ApexSQL Monitor?
- How to configure what queries will be collected and stored in the repository database?
- How does ApexSQL Monitor collects query wait statistic data and does it use SQL Server tracing?
- How can I specify a time frame for which the query waits data needs to be analyzed?
- What is the difference between the Grouped and Single executions options?
- Can I get more details about particular wait types that are the cause of query waiting?
- What are the details available for queries and how those should be interpreted?
- Can I exclude specific queries to prevent ApexSQL Monitor to collect them in the future?
- What if there is a need to monitor again queries that are excluded?
- How can I access some more extensive details about the particular query of interest?
- How can I display in charts only the data that are of specific interest?
- How can I isolate and display queries by its characteristics such as name, specific wait type they accumulated, login or application that executed them, etc.?
- How can I identify blocked queries and its blockers with details about blocking?
Why use query waits information when traditional performance metrics are available?
Traditional (old-fashioned) approaches in resolving SQL Server performance issues are often based on analysis of system and SQL Server performance counters. That means that analysis is based on various SQL Server metrics such as statistic of SQL Server locking, read and writes over a specific period of time, or system-based metrics related to CPU, memory, storage I/O or network. And while those counters could be useful, they cannot provide any direct and actionable information that is directly related to the database end user since they are providing the info about the SQL Server resources consumption rather than direct information about what is going on in the database as a consequence of the end user actions
Why is query waits information essential and how does it help in resolving SQL Server performance issues?
SQL Server is designed to ensure adequate service to the end user, and thus from the end user standpoint, the most critical performance parameter is how fast the user will get a response from the SQL Server after sending the request. As all communication between the end user and SQL Server is based on SQL Queries, ability to get details on each and every step that occurred in SQL Server between the SQL query is issued by the end-user and results that query returns to the end user
As all SQL Server data processing is related to the execution of queries, then it is logical that the performance problems are mainly related to queries. SQL Server has its mechanisms to track execution of queries, which includes not only the ability to track the time a query spends between the start and complete the execution but also logs the information what query is forced to wait for and how long at every step during its execution. Such granular information collected for every query executed by SQL Server allows more precise identification of the actual and potential bottlenecks that arise throughout the process of query execution.
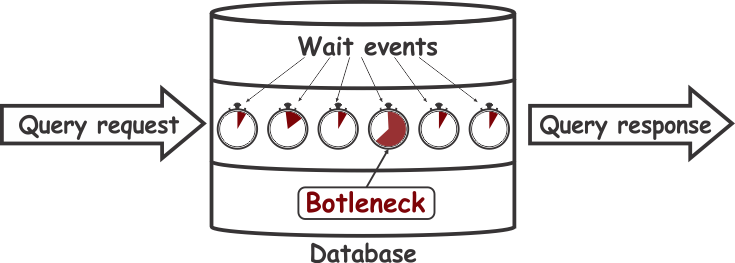
So, it is clear that tracking wait statistics related to a query execution can provide information about what and how long query waits at each execution step. That makes the information about the query waits to be both an authoritative and accurate tool that can be used in identifying the precise causes of the slow SQL Server query execution.
How can I access the Query waits feature in ApexSQL Monitor?
To access the Query waits feature in ApexSQL Monitor:
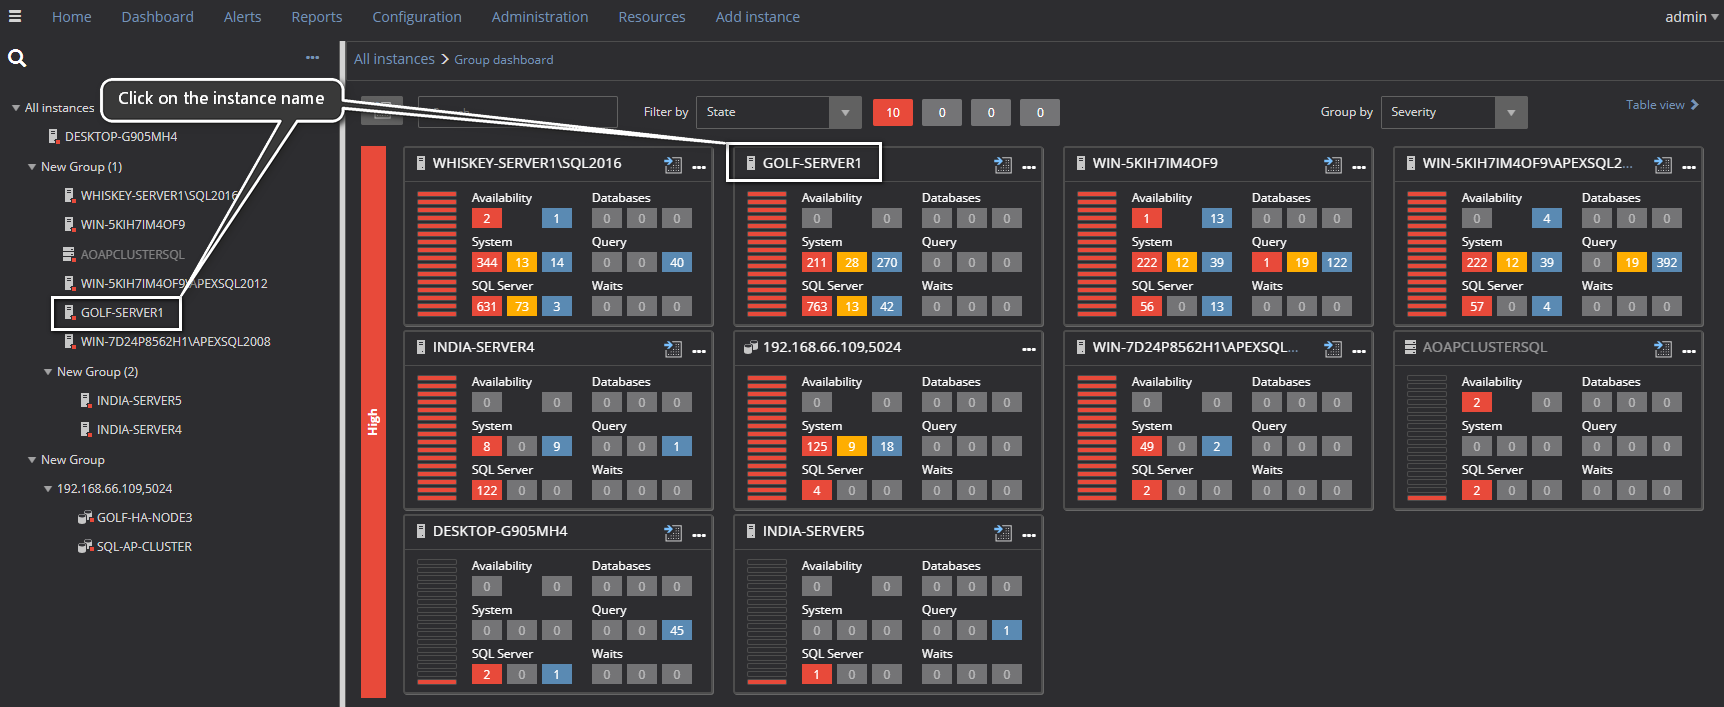
From the Main dashboard of ApexSQL Monitor
-
Click on the instance name in the dashboard panel or select the instance name in the instance explorer in the left pane of the page to open the dashboard of the specific instance
-
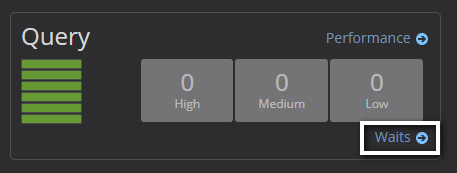
In the instance dashboard, click on the Waits link in the Query section
-
That will open the Query waits page of ApexSQL Monitor
How to configure what queries will be collected and stored in the repository database?
Use the Configuration link in the main menu to navigate to the Configuration page, and then select the Queries tab
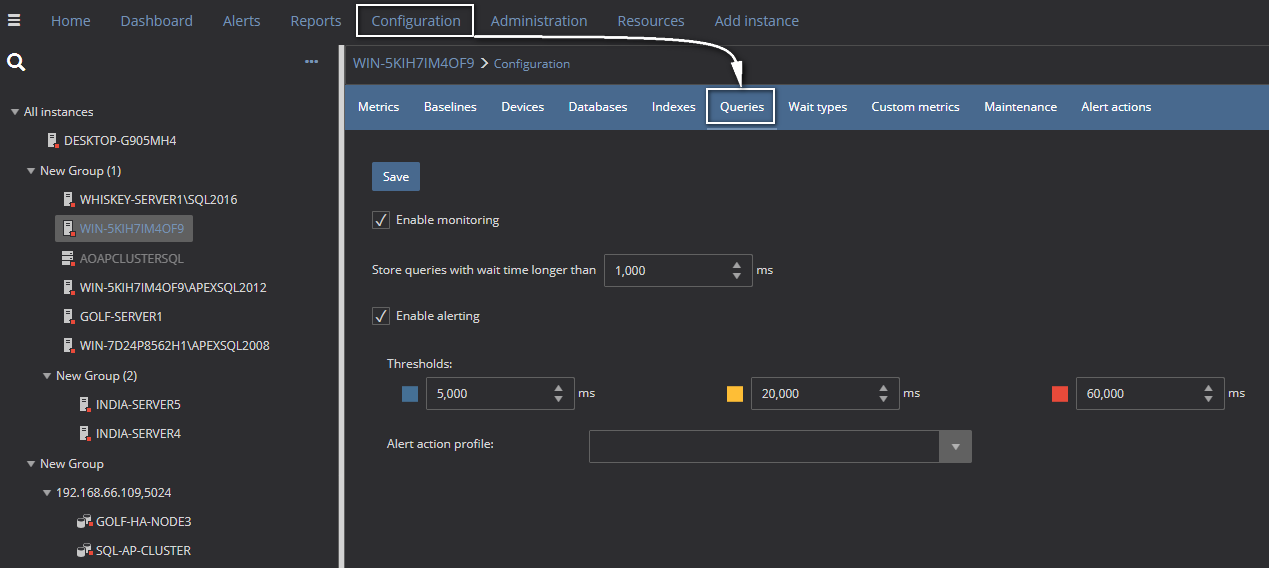
By default, ApexSQL Monitor will collect and store all queries which wait time exceeds 1 second. To change the minimal wait time that query have to accumulate to be collected and stored in the repository database, change the value of Store queries with wait time longer than
|
Quick tip: While having 1 second of the Store queries with wait time longer than |
The value allows setting the minimal time in milliseconds, which is particularly useful for bigger systems where a large number of queries executes during the day, as it will allow setting the precise threshold that can help to discard quite a large number of unneeded queries during the troubleshooting
ApexSQL Monitor allows configuring alerting for the excessive query waits values by default. To disable alerting, uncheck the Enable alerting checkbox
The predefined threshold values can be changed by the user, and it also allows precise threshold setting in milliseconds.
Alert action profile1 can be set as for any other metric.
How does ApexSQL Monitor collects query wait statistic data and does it use SQL Server tracing?
ApexSQL Monitor does not use SQL Server trace for collecting the query waits data, and therefore there is no overhead on the monitored SQL Server that SQL trace is inevitably causing. ApexSQL Monitor collects the query wait statistic by reading the information from the dynamic management view (DMV) that are associated with the SQL Server Operating System (SQLOS), using the standard queries. The resolution of collecting the query wait data is 1 second
|
Quick tip: Using the 1-second frequency of reading the query wait data is fixed and doesn’t change with increasing or decreasing the value of the Store queries with wait time longer than in the Configuration -> Queries page |
Using the 1 second frequency mean that collected query wait value can have an error of up to 0.99 second in the worst case, which is the insignificant error margin for modern production servers and is considered as a good trade of for the precision that SQL Trace can offer on expense of almost certain overhead that SQL trace can impose to the monitored SQL Server
How can I specify a time frame for which the query waits data needs to be analyzed?
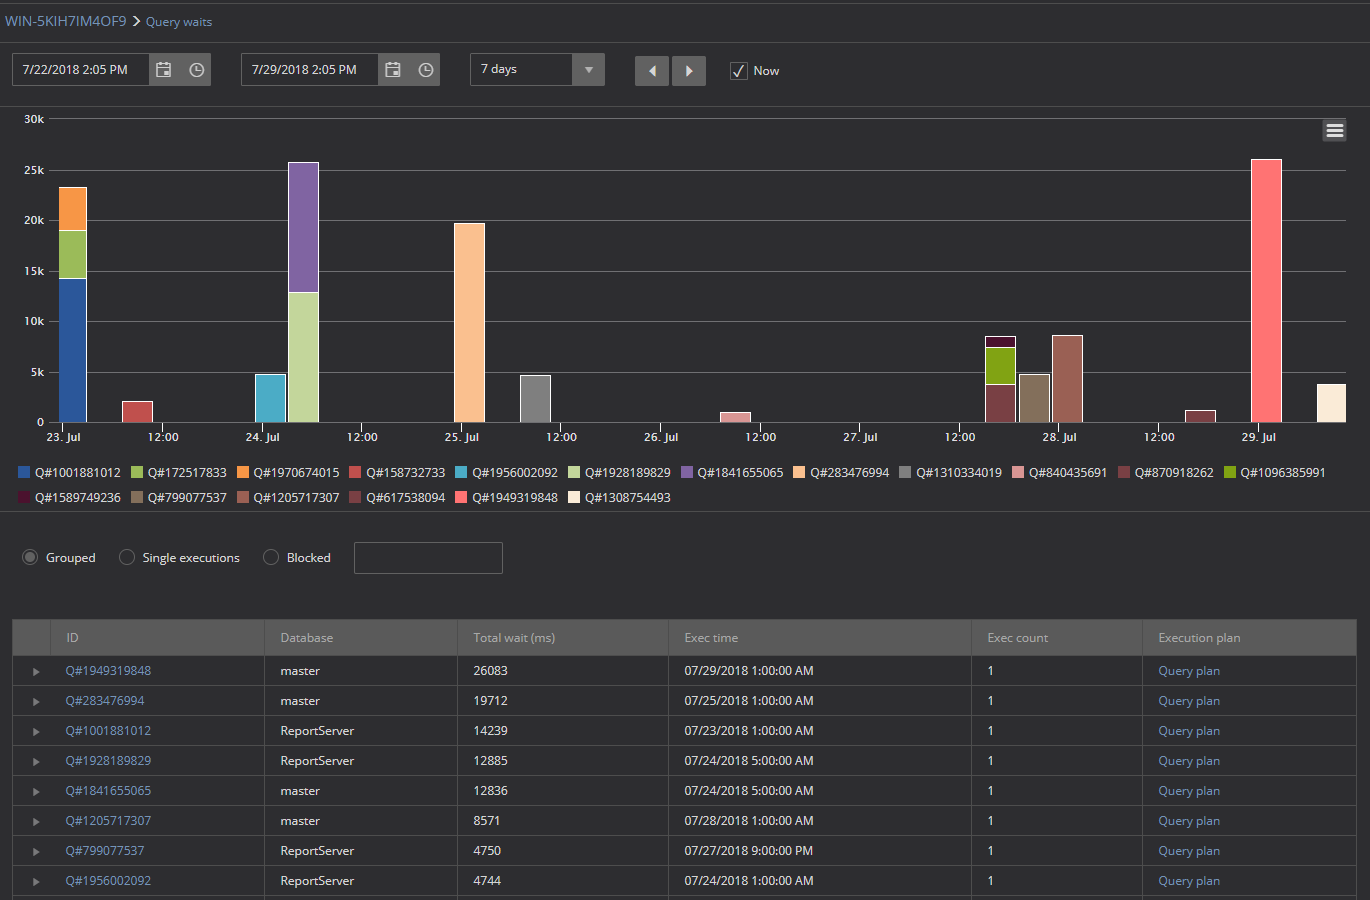
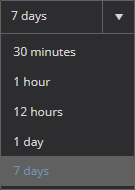
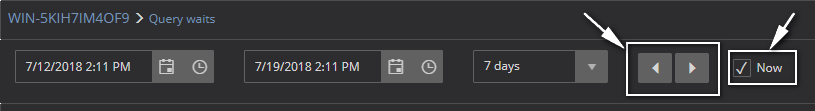
The user can use the drop-down date time pickers to choose the period of time that has to be analyzed. Selecting the start time or end time and specifying one of the predefined time frames allows fast navigation to the desired period
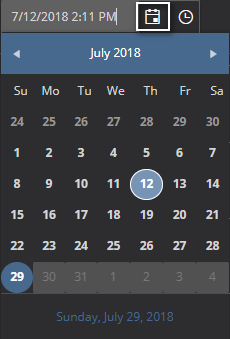
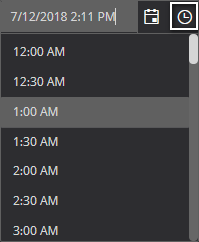
To navigate back and forth through the history use the left and right arrows next to the pickers. To quickly navigate to display the current time, check the Now checkbox
What is the difference between the Grouped and Single executions options?
The Grouped option is the most common way of displaying the query wait statistic, and it consolidates data from the multiple executions (which wait time is higher than the one specified in the query configuration) of the same query for a specified period of time, to be displayed as a cumulative data for that query. Therefore, the specific query will be displayed only once on the query waits page and all associated data are cumulative data for the specified period
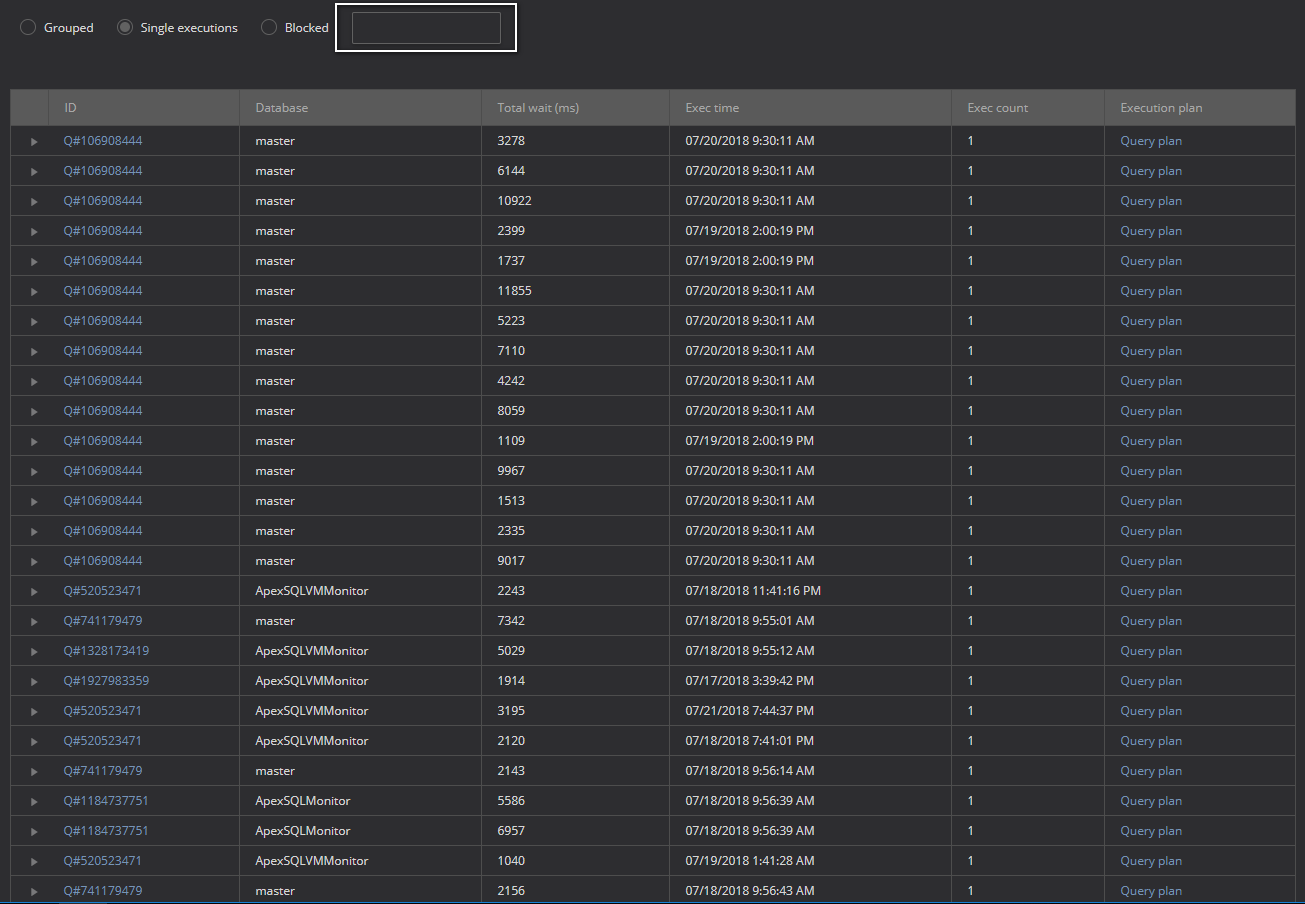
On the other hand, the Single executions option is quite unique for the ApexSQL Monitor, and it allows displaying the wait time as well as other related data for each and every specific execution of the queries.
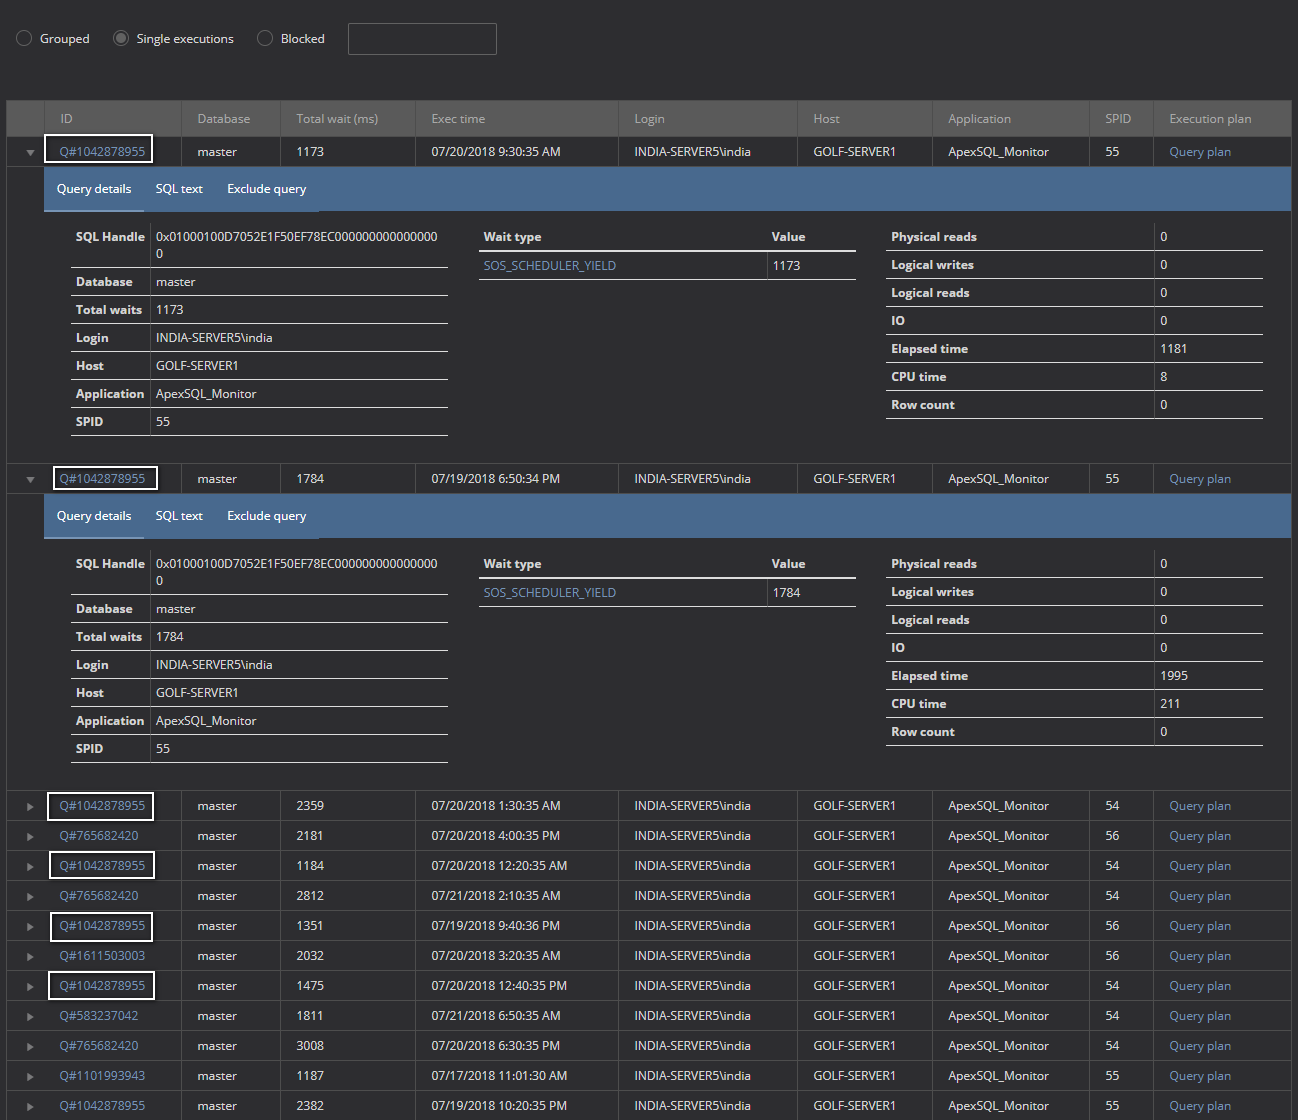
That practically means that if the specific query was executed 1000 times during the specified period of time and all 100 executions accumulated wait time larger than specified in the Configuration -> Queries page, all 100 executions with all relevant data for each execution will be displayed and available for analysis
Can I get more details about particular wait types that are the cause of query waiting?
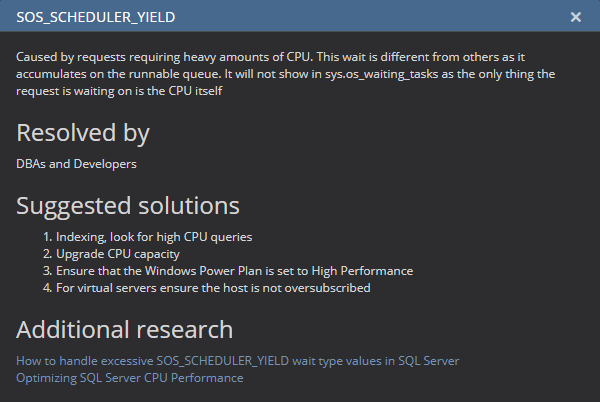
Yes. Just click on the wait type name link and the helper pop-up window with detailed information that include advice on resolution and additional links to more detailed resources related to that particular wait type.
What are the details available for queries and how those should be interpreted?
The Grouped query data are displayed in the table below the query wait chart. The table column titles are self-explainable so no need to provide additional details, except that clicking at the Query plan link in the Execution plan column will open the query execution plan for the selected query.
Additional details of the particular query are available after expanding the query by clicking on the  button next to the query name.
The Query details with necessary information about the query, SQL Text and Exclude query tabs are available after the query is expanded.
Can I exclude specific queries to prevent ApexSQL Monitor to collect them in the future?
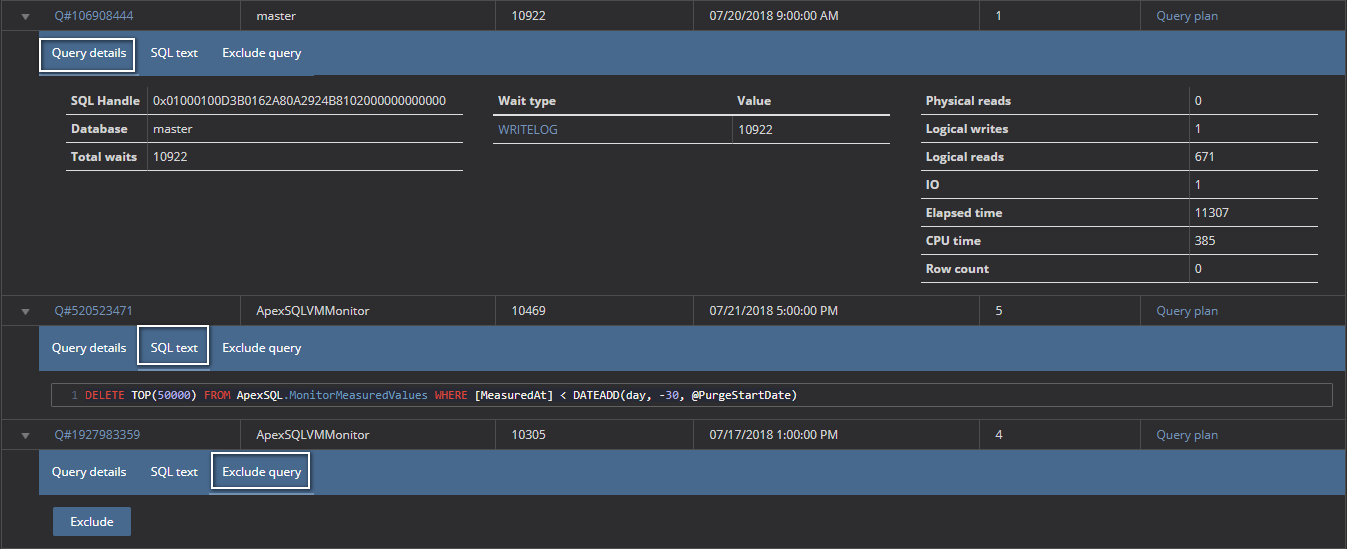
Yes, every query of user choice can be excluded from monitoring. This is especially useful in situations where a specific query or set of queries are frequently executing with anticipated higher wait time, so they can cause the sort spamming. To exclude particular query from monitoring, click on the  button next to the query name to expand it. Select the Exclude query tab and press the Exclude button
What if there is a need to monitor again queries that are excluded?
Once the query is excluded from monitoring, ApexSQL Monitor will store all the necessary information in the repository database including the complete list of all queries that are excluded. To start monitoring some query again:
- Click on the Configuration link in the main menu and then select the Queries tab
-
The query configuration page opens with the list of all excluded queries under the Include queries section
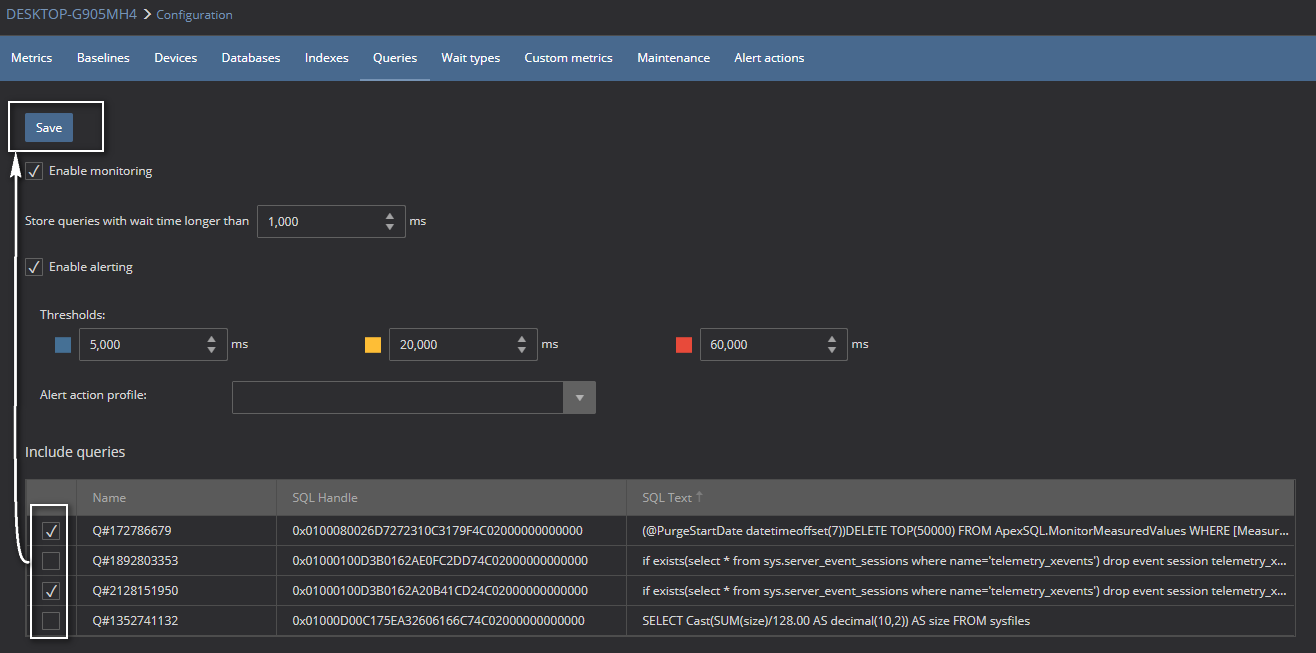
-
Check the checkbox next to the queries that should be monitored again and press the Save button
From that moment ApexSQL Monitor starts with monitoring of included queries again
How can I access some more extensive details about the particular query of interest?
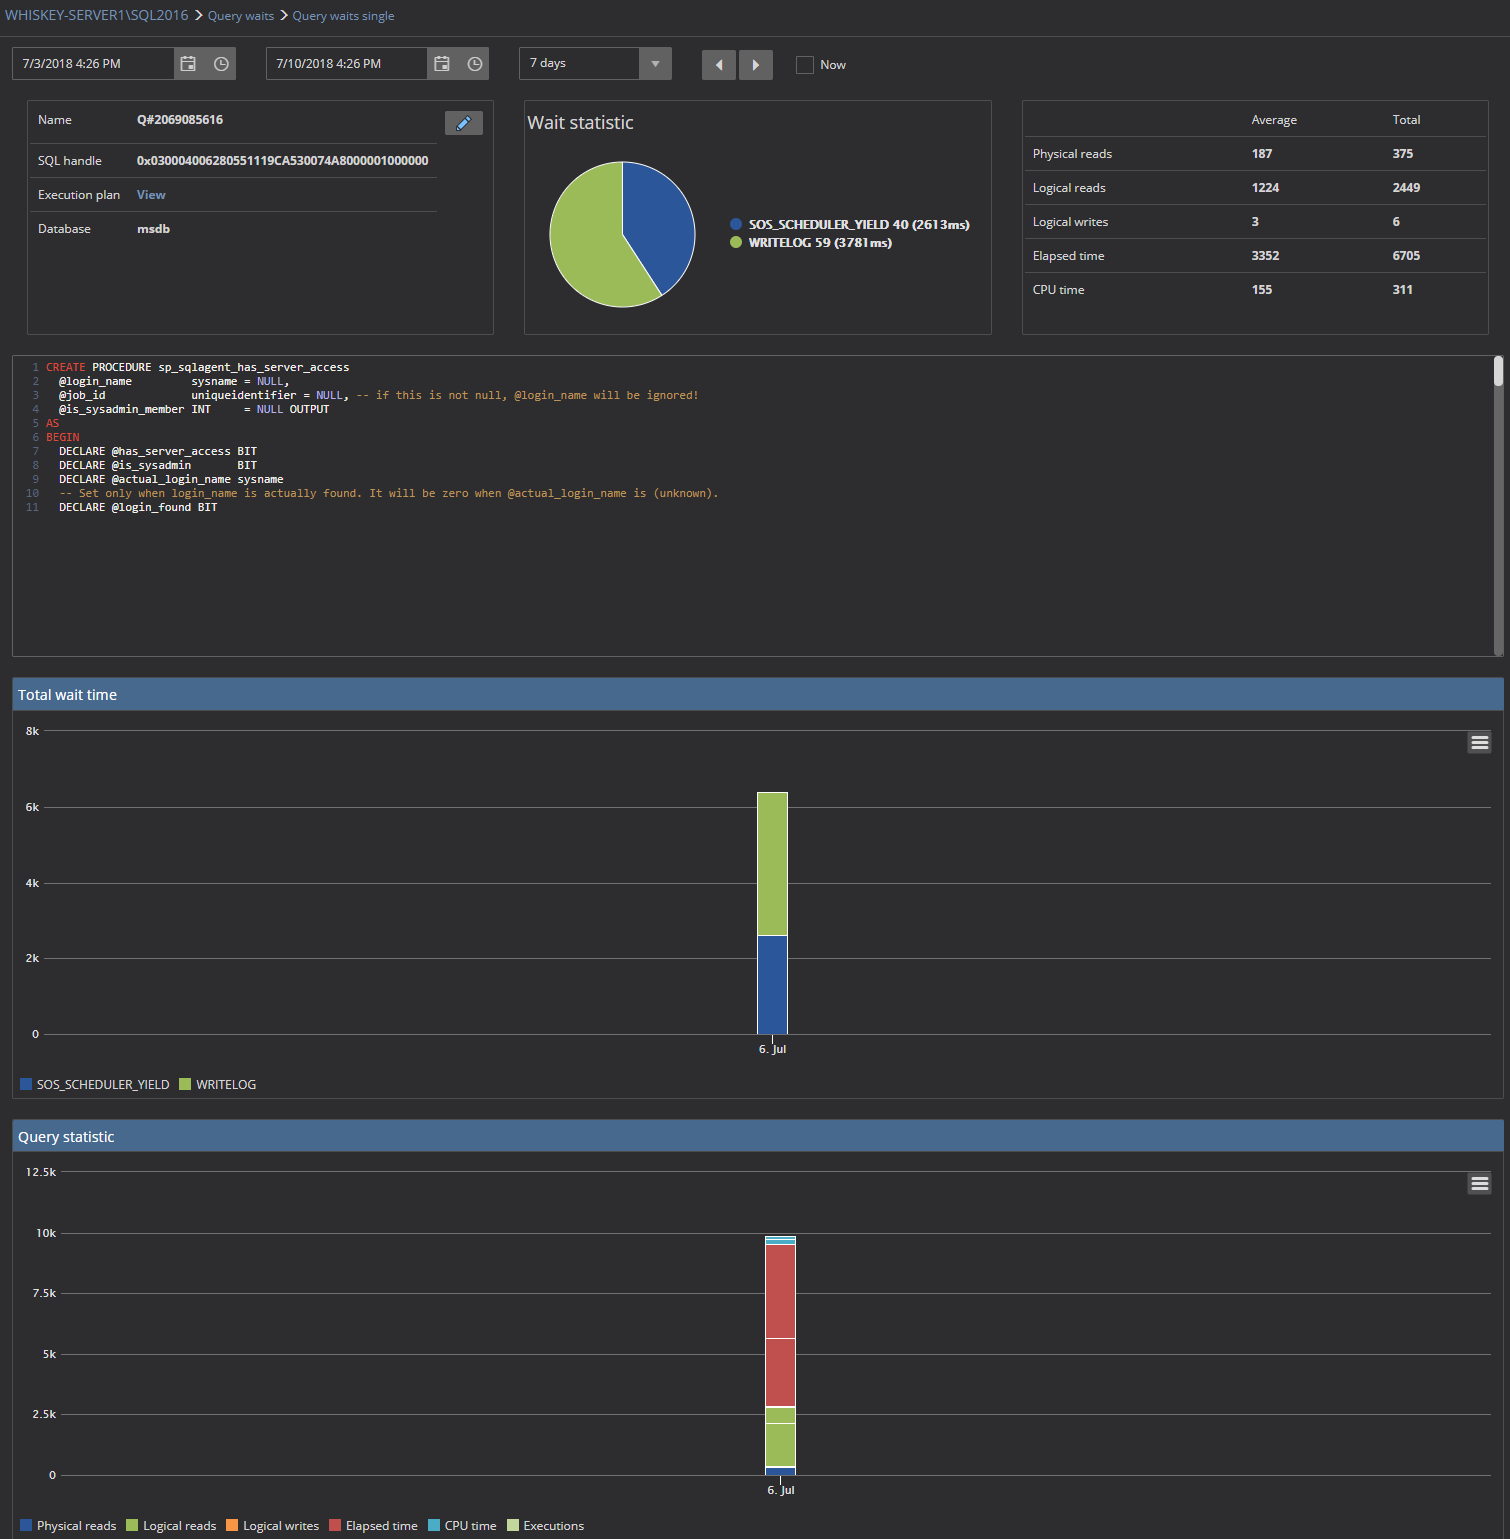
By clicking on the query name link, the new page with extensive details about the selected query is displayed.

Besides the standard set of information and query text, this page is suited with two specific charts: Total wait time and Query statistic
Total wait time chart displays the historical distribution of the wait time across the selected period for the selected query, including the wait types involved. In the example above it can be seen that query accumulated wait only in specific periods, that are not distributed evenly over the time. The below chart displays the situation where the query wait time is accumulated more evenly over the time
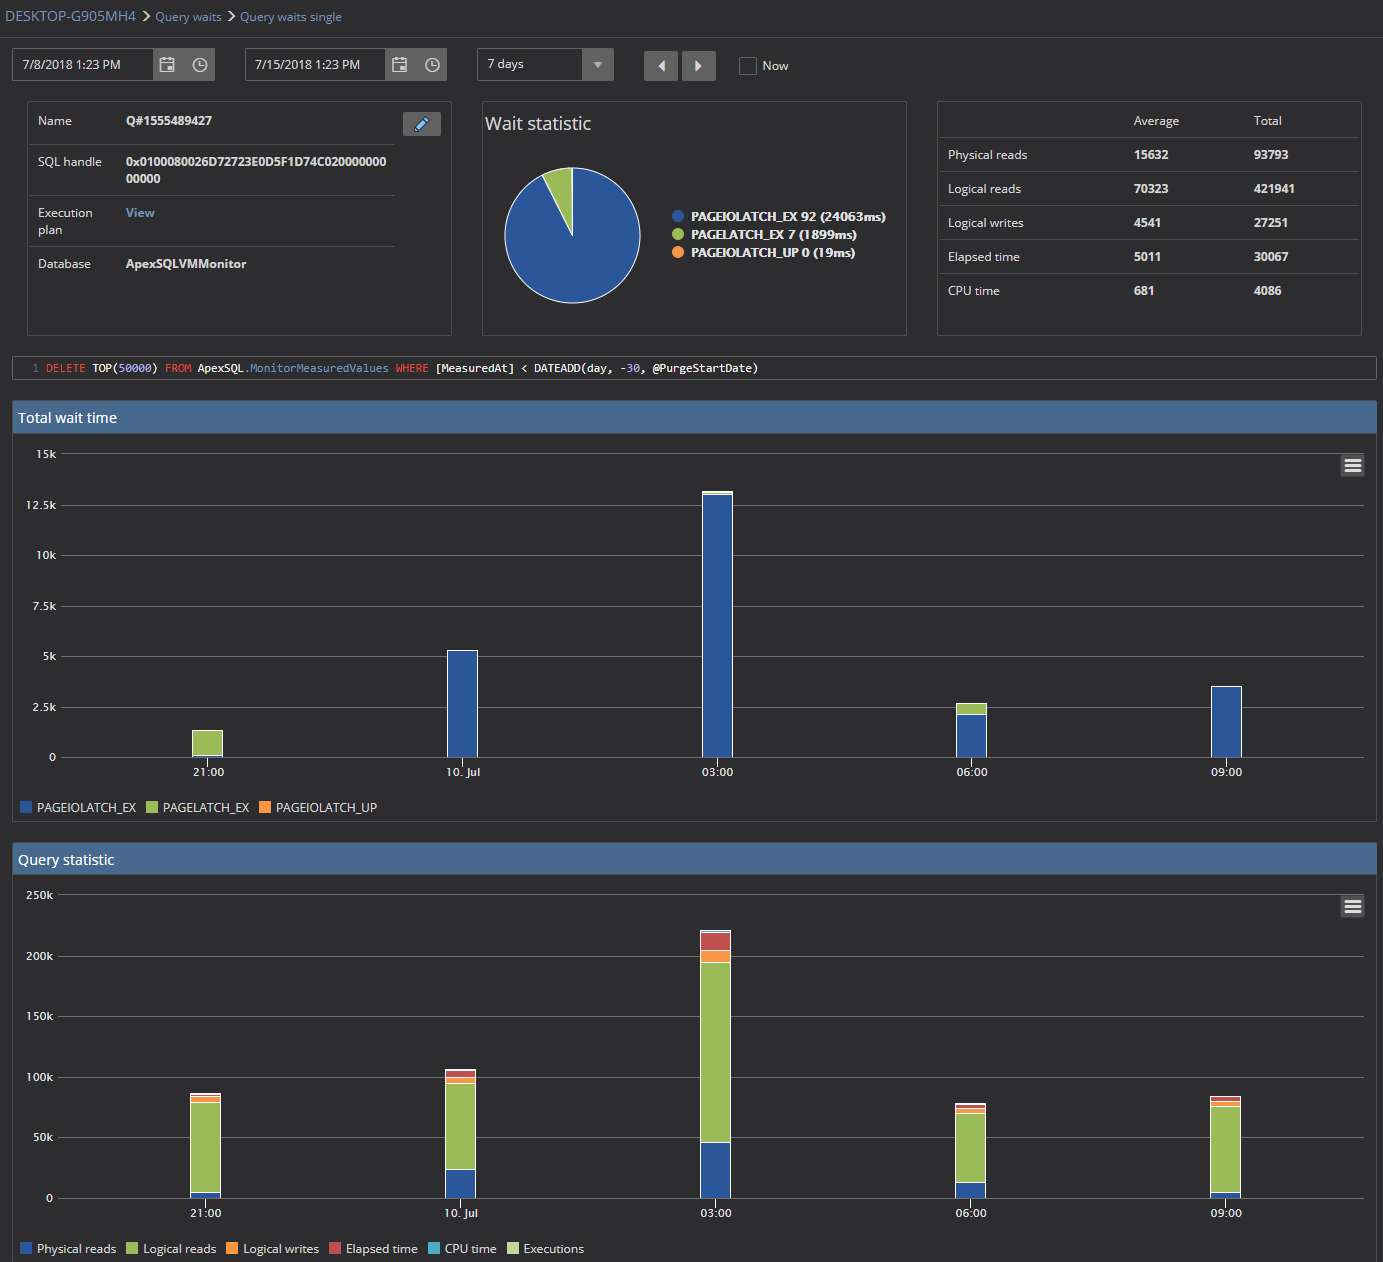
Query statistic charts display the consolidated view of statistical parameters of the query and its distribution over the time that should supplement the wait statistic information and allow better insight into the potential issues and its causes. The following information is presented: Physical reads, Logical reads, Logical writes, Elapsed time, CPU time and Executions (number of)
How can I display in charts only the data that are of specific interest?
By clicking the name of the wait type or the query statistic in the chart legend, it can be turned off or turned on in the chat, allowing in that way displaying only the necessary data and eliminate what is not needed for analysis
How can I isolate and display queries by its characteristics such as name, specific wait type they accumulated, login or application that executed them, etc.?
ApexSQL Monitor has a universal real-time search field on that page that can be used for searching and displaying queries by any of the data related to them.
As soon as the user starts to type in the field, the application will start to search and display the data that comply to the data entered in the search field
For example, if all queries that contain WRITELOG wait type have to be found, as soon as the typing is started the data starts to display.
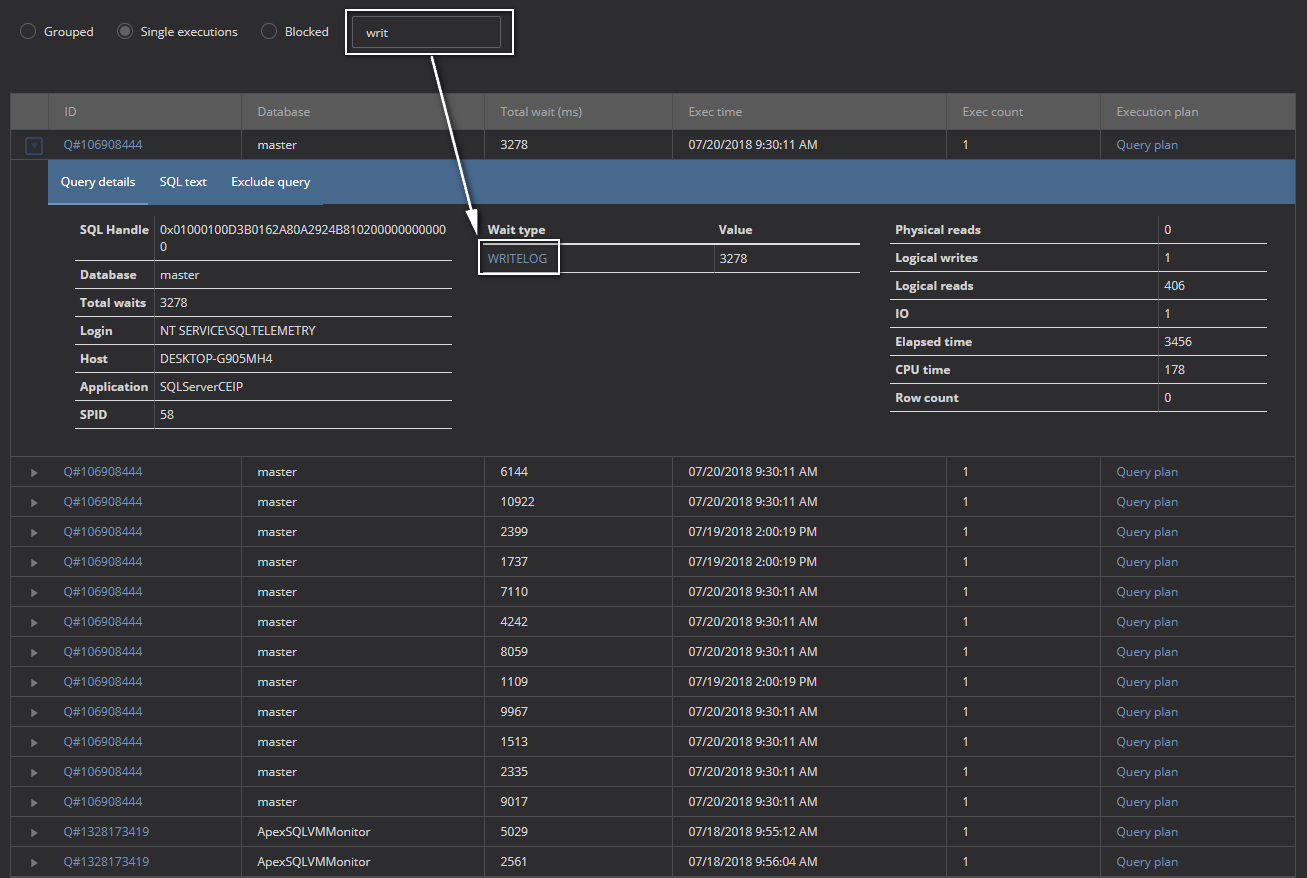
As it can be seen, even the partial info typed will return desired queries, as the above example with WRITELOG displays
The ApexSQL Monitor search engine uses the “contain” logic, which mean that the user can type any part of the sought term and application will return adequate results
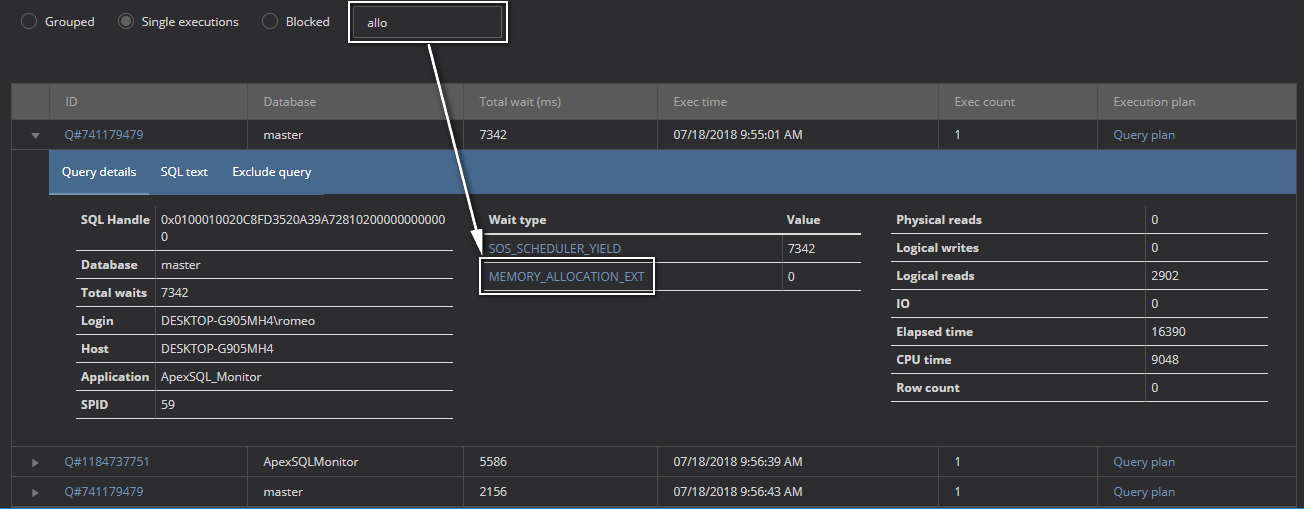
In the above example, the “allo” is typed to find all queries that contain MEMORY_ALLOCATION_EXT
How can I identify blocked queries and its blockers with details about blocking?
ApexSQL Monitor can track wait statistics on the individual query level, and thus it can track the queries that are blocked as well as the queries that are the cause of the blocking.
To identify blocked queries using ApexSQL Monitor:
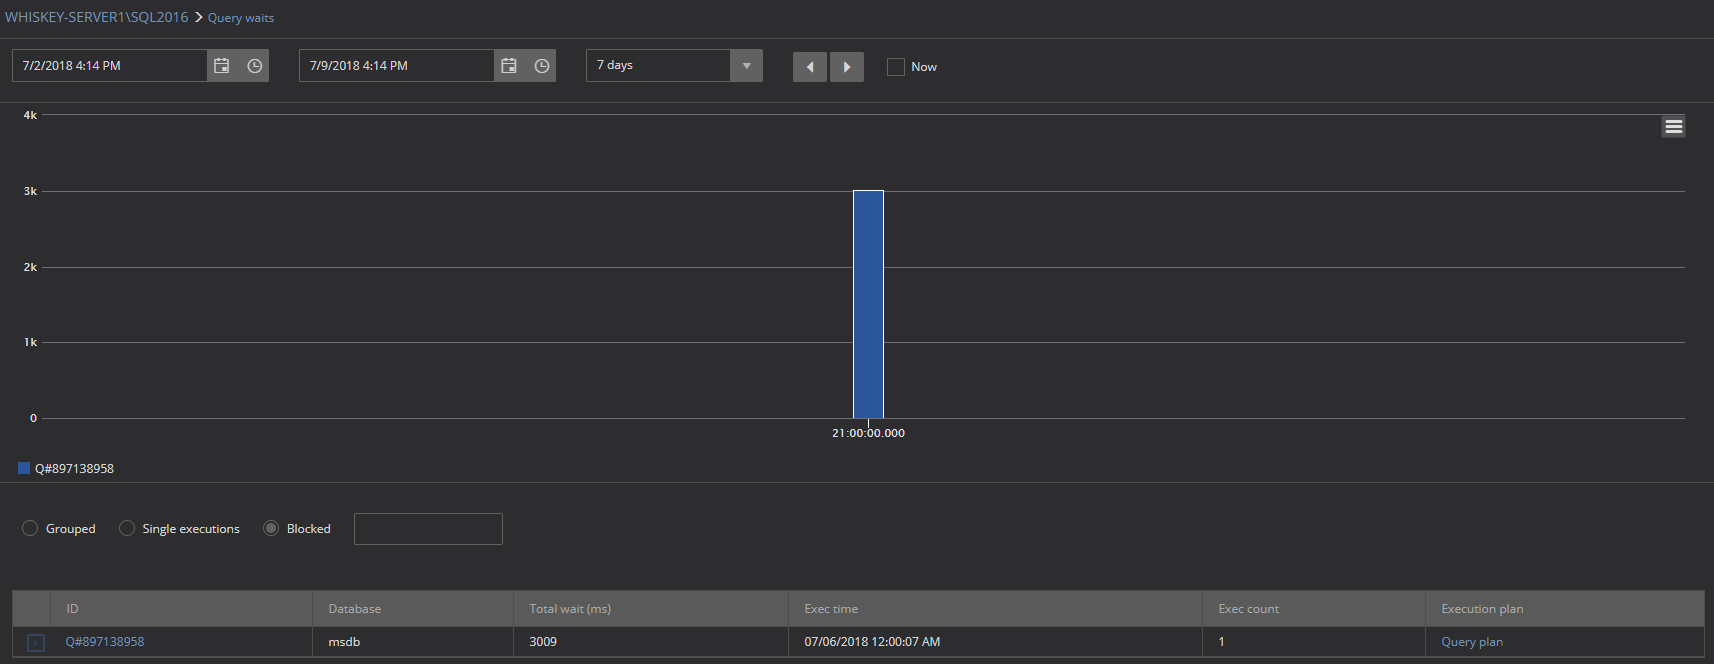
- In the Query waits page, check the Blocked radio button
-
If any blocked queries are present in the selected time frame, they will be listed in the grid and displayed in the chart
By expanding the listed query using the  button next to the query name, details about the blocking will be displayed
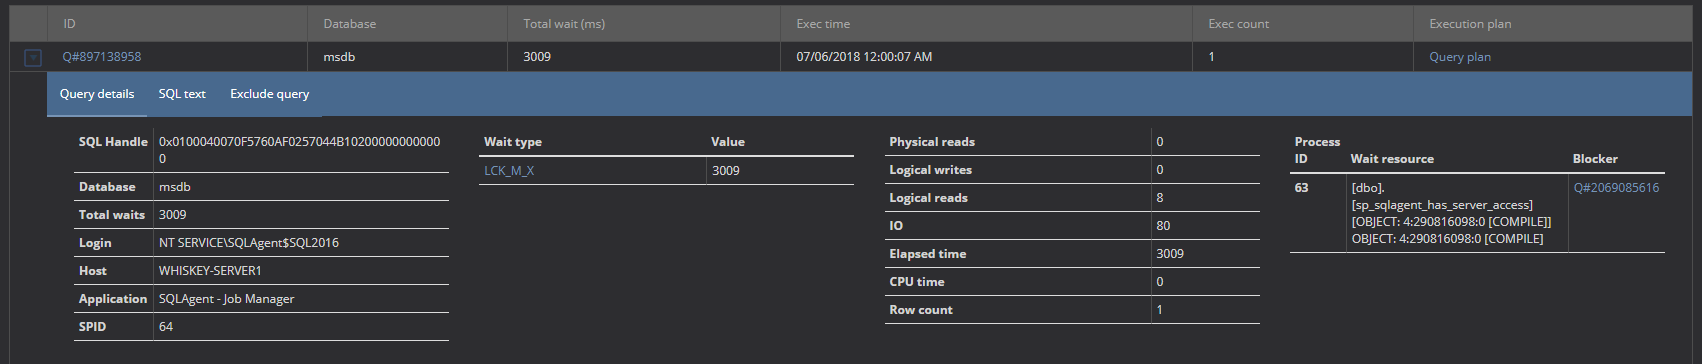
Here, the most important information can be found on the right under the Processes section:
- ID (SPID) number of the process that is the cause of the blocking (63 in the example above)
- Waitresource is the SQL Server resources engaged in this SQL Server block. This is the standard info defined by Microsoft and to understand how to decipher the value of the Wait resource section, please check the Microsoft article INF: Understanding and resolving SQL Server blocking problems
- Blocker section contains the link to the details page of the query that is the cause of the blocking
Since every SQL Server query blocking situation is when one query (process) wait on another query (process) that already acquired the lock on the SQL Server object (resource), to release the lock, so that query that is blocked can acquire the lock. The blocked query will remain blocked until the query that caused the blocking release-off the lock on the object that is a mutual target. SQL Server uses LCK_M_XXX wait types to register that blocking. Check All about locking in SQL Server for more details about the SQL Server locking and blocking
More information on how to set up and use alert actions can be found on the following links:
- Working with email notifications and email profiles in ApexSQL Monitor
- How to use custom SQL script alerts in ApexSQL Monitor
- How to use custom command alert actions in ApexSQL Monitor
- Configuring and setting up the SNMP trap in ApexSQL Monitor
- How to set up SMS alert notifications in ApexSQL Monitor


