


Applies to
ApexSQL Monitor
Summary
This article describes advanced options that allows for manually adjusting and fine-tuning calculated ApexSQL Monitor baseline threshold values to meet specific alerting, in response to calculated baseline values deviations.
Description
ApexSQL Monitor calculates the baseline for collected performance data over a specified historical period. By default, a minimum of seven (7) days of data is required for any baseline calculations, as this is the minimum amount of data to be statistically significant. What these means is a sufficient level of data is acquired to smooth out spikes, statistical outliers and other anomalies that might otherwise distort the data and present an inaccurate picture of historical data, as a whole.
What is ‘Statistical Significance’
“Statistical significance means that a result from testing or experimenting is not likely to occur randomly or by chance, but is instead likely to be attributable to a specific cause. Statistical significance can be strong or weak, and it is important to disciplines that rely heavily on analyzing data and research, such as finance, investing, medicine, physics, and biology.” 1
In some specific cases or during some tests, calculating baselines for a period smaller than 7 days might be required. For those who need to expand the calculation periods to less than 7 days, an option was provided. More information about that can be found in the How to baseline performance data for a less than a seven days period
In general, the longer historical data period is used for the baseline calculation, the more statistically significant the baseline calculation is going to be, which includes performance spikes and other data anomalies that need to be highlighted.
In addition to built-in baseline calculations, ApexSQL Monitor provides for the ability to change the precision already calculated baseline values. However, before explaining how to change the calculated baseline values, it is essential to understand how those baseline values are calculated in ApexSQL Monitor.
First, some essential elements of the SQL Server metric baseline:
-
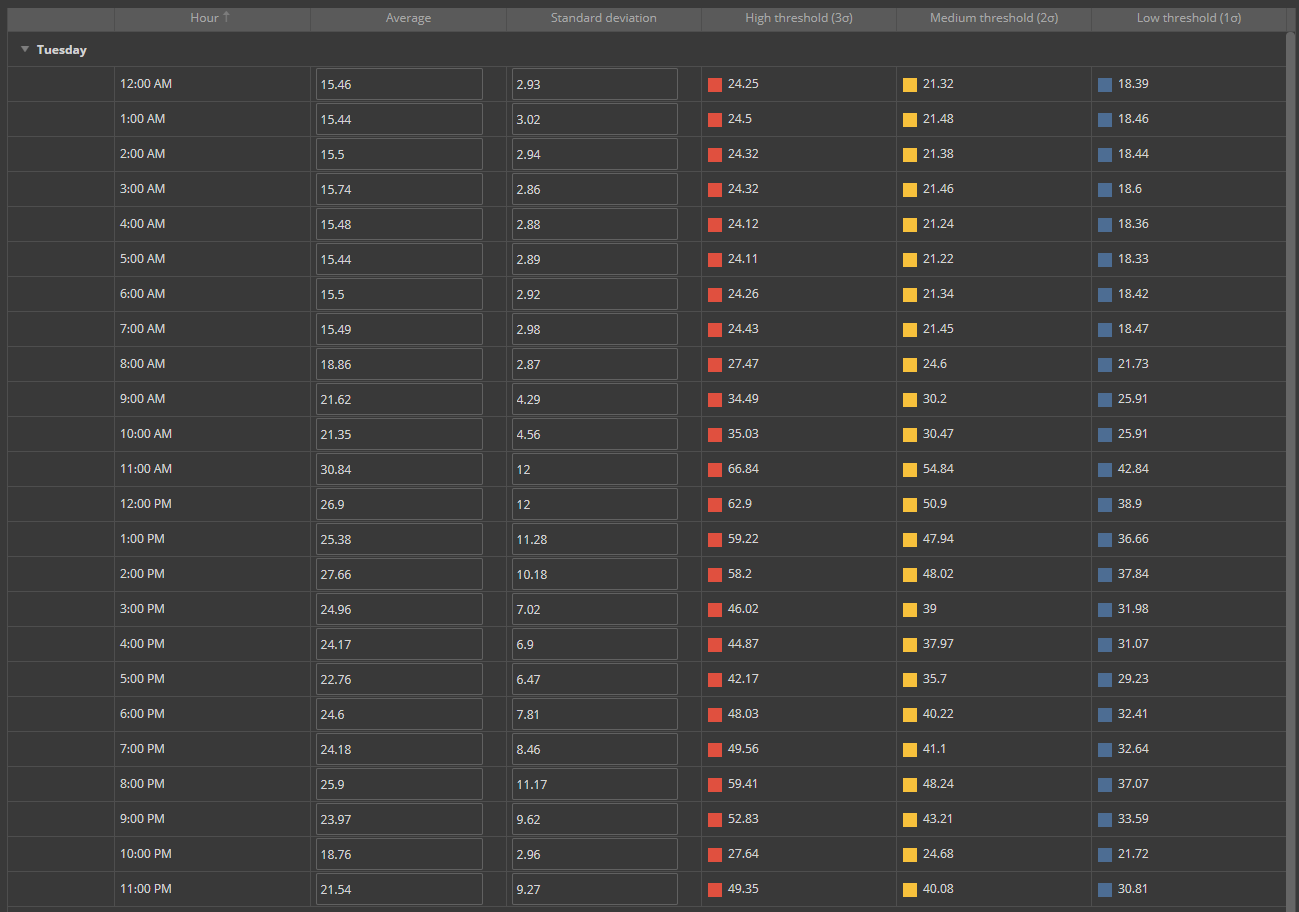
Average (Mean) – This is the calculated average of the collected historical data. ApexSQL Monitor calculates the average value per hour and per day of the week of historical data, thus allowing a higher precision of “rolling” baseline where needed depending on the specific performance metrics requirements
-
Standard deviation (sample variance) – It is a measure of how much a collected data differs from its average, or in simple words, a standard deviation shows how dispersed data are around the calculated average
The baseline calculation used in ApexSQL Monitor depends on the period used for calculation:
-
Calculate baselines for a time range of 7 days or longer
Baselines are calculated for each hour of the day and each day in a week.
The algorithm generates 168 values per each metric and if the metric uses multiple sources, for each source separately (i.e., Average read time metric collects for each storage device, so if there are multiple storage devices metric collects for each device separately, so the baseline calculation).
The average calculates per each hour and day of the week. To illustrate how this works, let’s take an example where a baseline is calculated for three weeks. In this case, ApexSQL Monitor uses all measured values collected during three Mondays, between 10 AM and 11 AM to create an average and standard deviation for Monday 10 AM. The more extended period used for baseline calculation, the more precise is a calculation. The baseline can be displayed for each day of the week separately.
-
Calculate baselines for time range between 1 day and a period less than 7 days
Baseline calculates for each hour of the day.
The algorithm generates 24 values per each metric and if the metric uses multiple sources, per each source separately. There is no split per days of the week, but the calculation takes into account all days in the time range. If we have to calculate the average for 10 AM, ApexSQL Monitor uses all measured values collected between 10 AM and 11 AM for all days during the calculation period create an average and standard deviation for 10 AM. In this case, the same baseline displays for each day of the week.
-
Calculate baselines for less than 1-day time range
Only one baseline value generates per metric and if the metric uses multiple sources, per each source separately. The application calculates the average from all data for given metric in that calculation period.
ApexSQL monitor calculates a baseline for all system, SQL Server, and database metrics, including AlwaysOn Availability Group metrics and wait statistic metrics. Exceptions are status metrics (i.e., System availability, SQL Agent status, etc.).
For calculating standard deviation, ApexSQL Monitor is using the Welford’s method. The calculation method is sophisticated but for those who need more detailed information on calculation method, check the Accurately computing running variance and Welford’s method for computing variance articles.
Now with in-depth knowledge of how ApexSQL Monitor calculates the baseline and what methods are used, let’s explain how to use this advanced ApexSQL Monitor feature.
ApexSQL Monitor allows customizing the calculated baseline separately for each performance metric. To access the feature:
-
After selecting SQL Server instance in the server list, click on the Configuration link in the main menu

-
Select the Baselines link from the configuration submenu
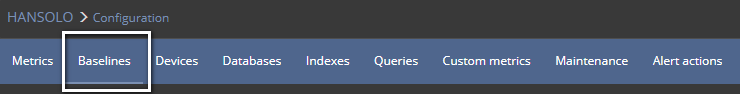
The Baseline page appears
-
Chose the performance metric for which the baseline threshold should be adjusted and press the
 button
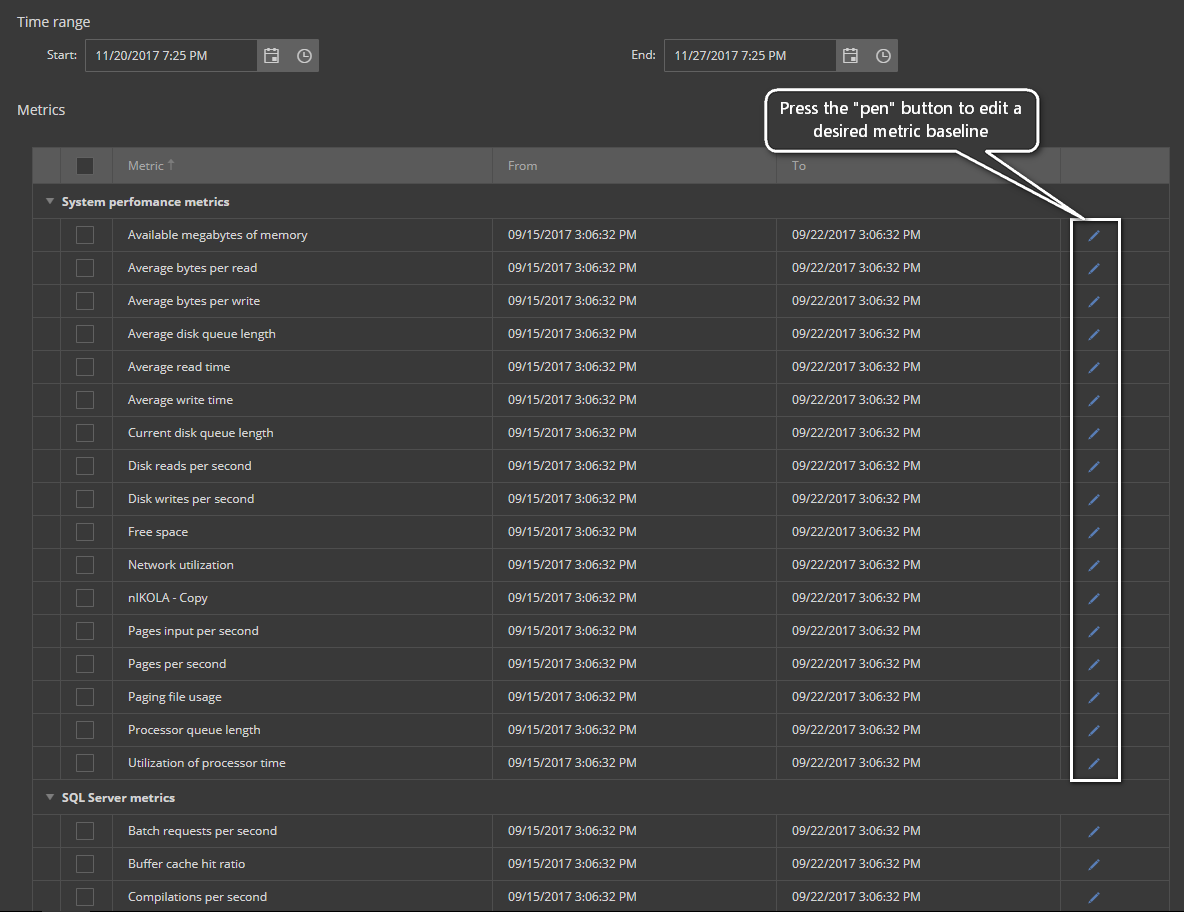
The page with baseline details for selected metric appears. The page consists of four sections, of which three are configurable by the user.
The top left section is info section where the historical period used for the baseline calculation is displayed.
The top right Metric configuration section allows quick metric configuration where the user can enable/disable monitoring and/or alerting, for a particular performance metric, as well as whether the predefined fixed or baseline thresholds will be configured to use for alert-triggering.
The next two interactive sections, the baseline adjustment chart, and the baseline adjustment table are essential parts of this feature and below are explained in detail.
The interactive baseline adjustment chart provides a drag and drop technique to change the calculated value of the average (mean) in a particular point of time. The user just needs to click on the specific node in the chart and while holding the mouse button move up or down to change the value. Depress the mouse button when the desired value is set.
The associated tooltip displays relevant data such as Average value as well as High, Medium, and Low baseline threshold values as soon as the mouse pointer hovers close to the node area. The tooltip displays all the data changes in real time while dragging the node.

Changing the average changes the calculated high, medium and low threshold values based on a predefined calculation of standard deviations. All the changes made in the chart transfers synchronously in the table below the chart.
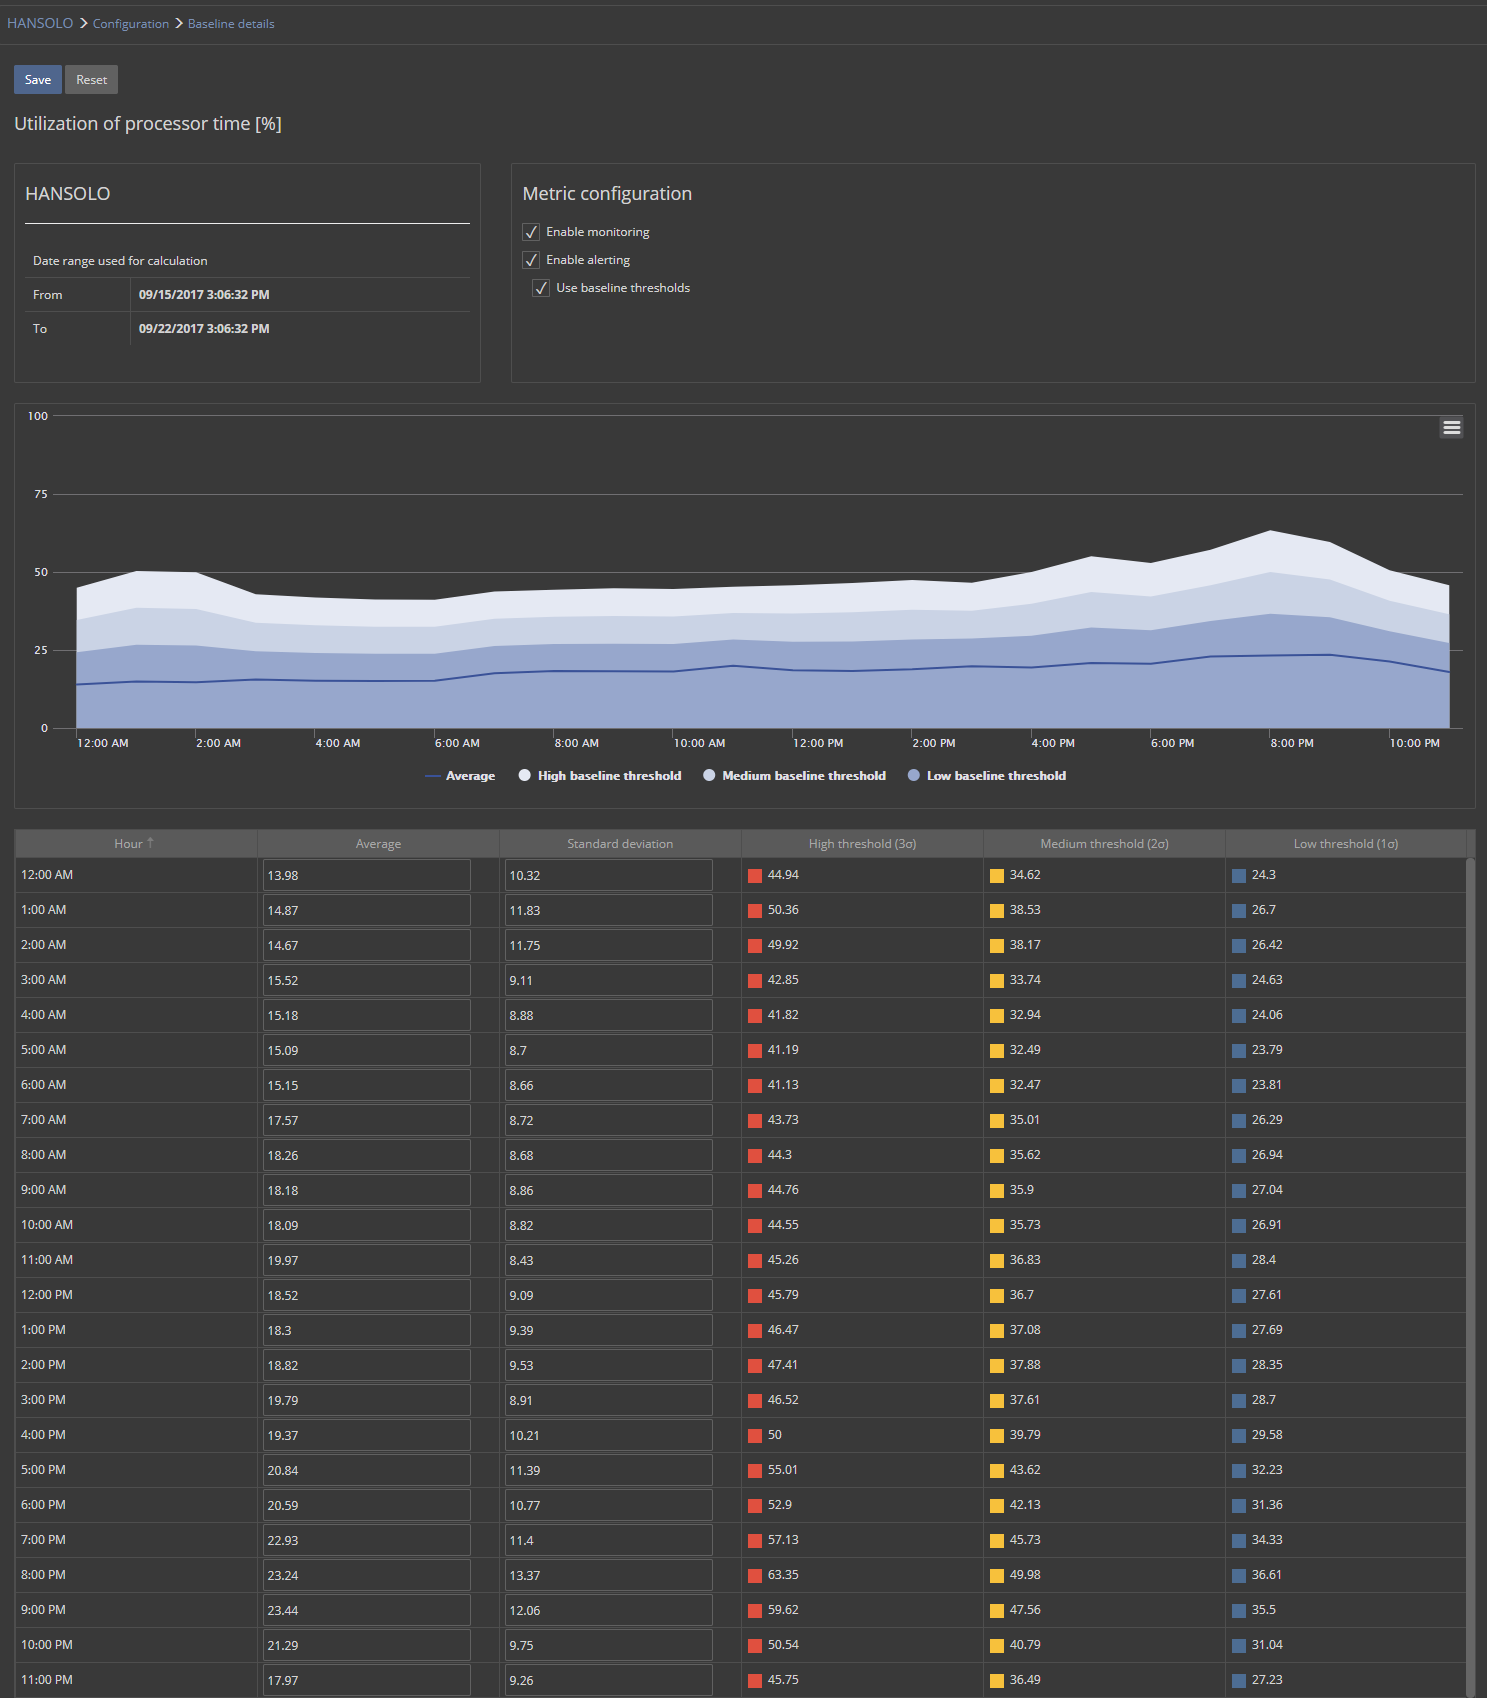
By default, the chart displays the calculated baseline for all seven days of the week (if 7 days or larger time range was used to calculate the baseline).
If the adjustment has to be performed just for the specific day(s), press Select the days of the week and select the specific day of the week.

The filter allows selecting more than one day to be displayed in the chart, so just click to select days that have to be displayed while the filter is open.

All changes made in filter automatically applies to the chart and table so that the user can have full control and preview of the selections used in the filter.
For those who need even more control over the calculated baseline, the table with calculated baseline values below the chart is included. Also, the table has an even more advanced feature that allows the user to change the calculated standard deviation.
|
Quick tip: Any change made in the chart applies automatically to the table and vice versa |
By increasing or decreasing the standard deviation value, the user can increase or decrease the area between the of low, medium and high threshold aka threshold delta without changing the calculated value of the average. The ability to change the standard deviation is especially useful in situations where the difference between thresholds has to be increased or decreased. On contrary, by changing the average, the delta between the thresholds remain the same when the threshold values changes.
The following example shows how the changing of the standard deviation value affects the calculated threshold values.
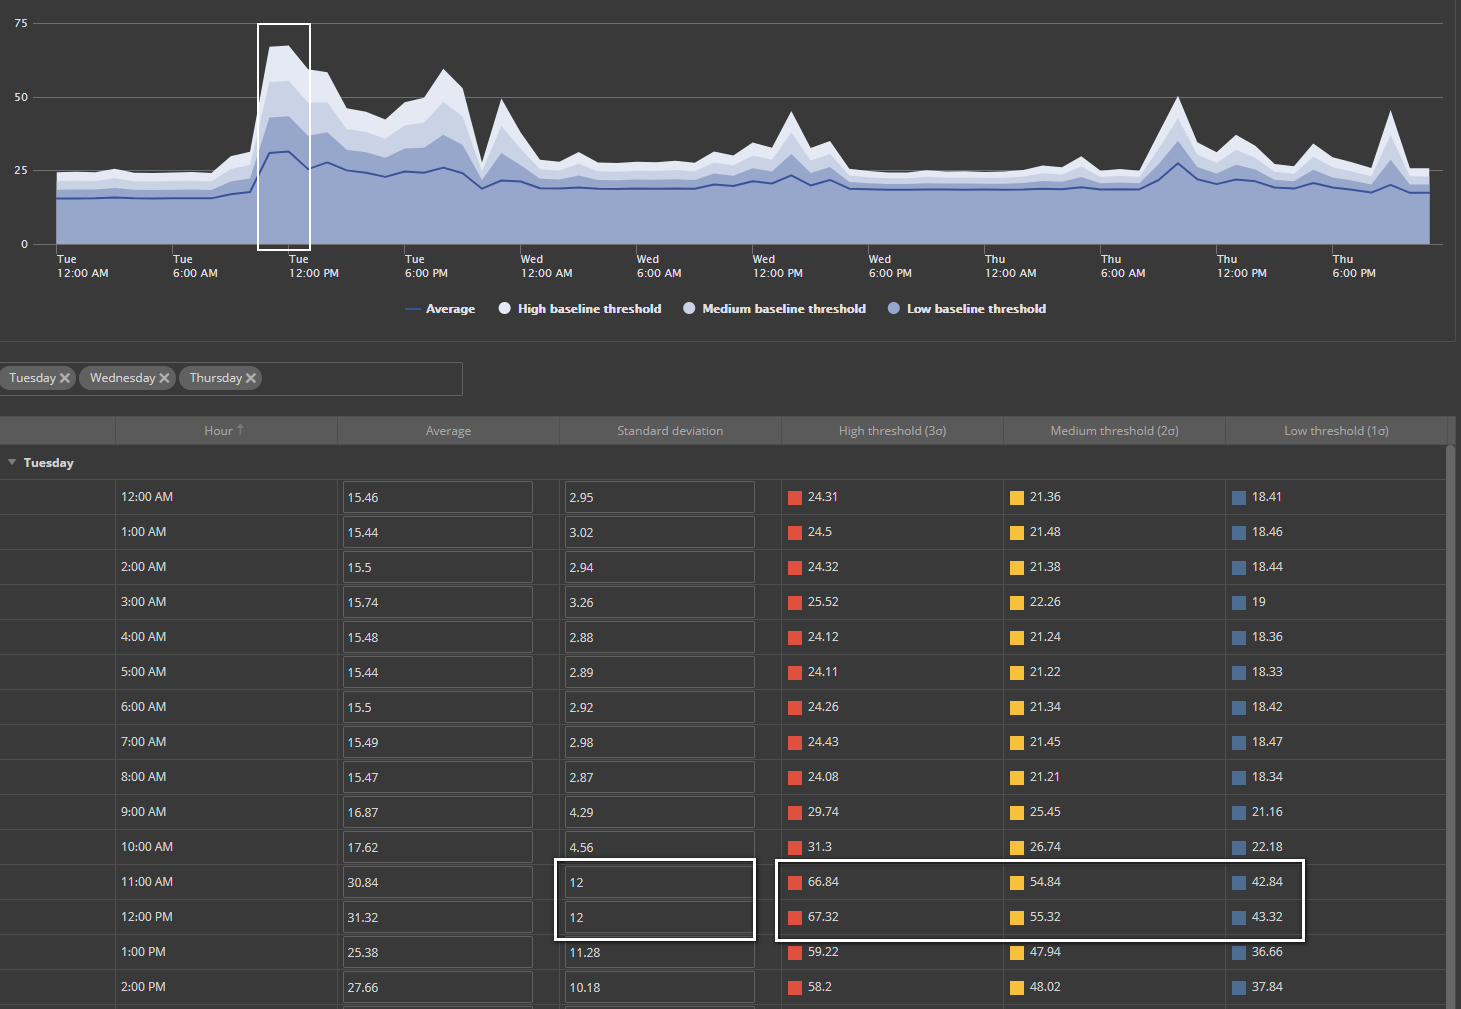
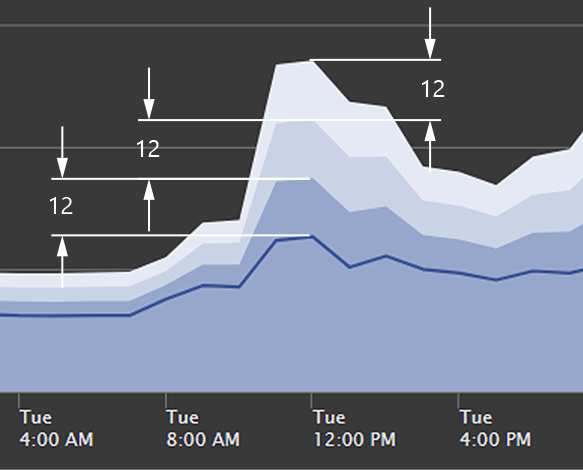
In the above shot, two specific points in time are marked in the table and the chart. Attention should be paid to the threshold values for those two. The difference between the threshold value is equal to the standard deviation, and this is how it looks like on the chart.
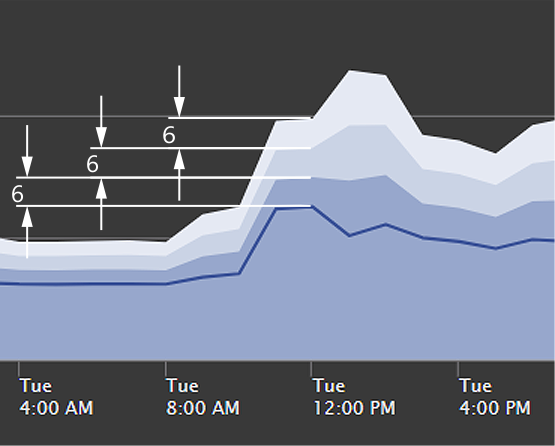
Now, by changing the value of the standard deviation from 12 to 6, the values of the thresholds changes.

The next image is how the change looks on the chart.
Once all changes are made, press the save button to apply changes. Changes are valid immediately.
FAQs
Q: If I recalculate baseline for the metric which baseline is custom adjusted, will I overwrite any previous customizations?
A: Yes. Once you recalculate the baseline, the newly calculated values overwrite all custom changes.
Q: Can I recalculate baselines partially by excluding metrics where the baseline calculation is adjusted?
A: Yes. When performing a baseline recalculation, do not check the metrics that you want to exclude from the calculation, and they remain intact.
Q: ApexSQL Monitor does not allow baseline calculation for periods smaller than 7 days. Is there an option that would allow me to do that?
A: Yes, but this is an option for advanced users. Calculating baselines for less than seven days is not recommended, but we are aware that this can be useful for development or testing, so we made a provision for the user to remove the limitation. Check the How to baseline performance data for a less than a seven days period


