


Applies to
ApexSQL Monitor
Summary
This article shows the reporting functions needed for ad hock reporting including what each function is, why the function is needed, when each function should be used and how those functions should be used. The reporting functions are designed to help user in retrieving the needed data from the repository database without need to understand and know the data and schema structure of the repository database
Description
The following functions are Table valued functions, and the main purpose of these functions is to allow user to create reports without having to be familiar with the actual data and schema structure of the ApexSQL Monitor central repository database. When the function is called, it will retrieve needed data from the adequate tables, call the helper function to process these data, and return to user the results that can be processed further by the report query
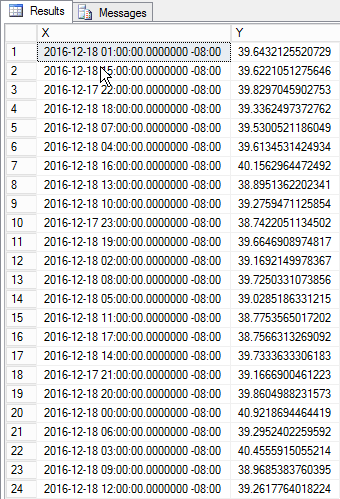
MeasuredValueLineChart – Returns line chart data X(Time),Y(Value)
Description: This function will allow user to get data for the specific metric and the precise time when those metric data has been collected. The primary purpose of this function is for creating the report charts for a specific metric that user want to display
Example call: The function is designed to be used in the select statement of the final report query for retrieving requested data from the repository database
SELECT X,Y FROM [ApexSQL].[MeasuredValueLineChart](
    ApexSQL.SourceNameToId(@MachineName),
    ApexSQL.MetricNameToId('% Processor Time'),
    @StartDate,
    @EndDate,
    0)
Parameters:
@SourceId – Unique ID of the metrics source
Type: uniqueidentifier
@MeasurmentId – Unique Id of the performance metric
Type: uniqueidentifier
@StartDate – Start period of the required metric data
Type: datetimeoffset
Form: ‘2016-11-01 00:00:00.0000000 +01:00
@EndDate – End period of the required metric data
Type: datetimeoffset
Form: ‘2016-11-01 00:00:00.0000000 +01:00
@Interval – Interval in minutes that will be used to feed the the CalculateInterval helper function for calculation. By default, the value is set to 0. For more information on this, please refer to Calculate default interval – [ApexSQL].[CalculateInterval] helper function in the “ApexSQL Monitor ad hoc reporting Helper functions inventory, descriptions and examples” KB article
Type: integer
Example result:
Defintion:
CREATE FUNCTION [ApexSQL].[] (
	@SourceId UNIQUEIDENTIFIER
	,@MeasurmentId UNIQUEIDENTIFIER
	,@StartDate DATETIMEOFFSET
	,@EndDate DATETIMEOFFSET
	,@Interval INT = 0
	)
RETURNS TABLE
AS
RETURN (
		SELECT MAX(ApexSQL.FTruncateDate(MeasuredAt, [ApexSQL].[CalculateInterval](@StartDate, @EndDate, @Interval))) AS X
			,AVG(Value) AS Y
		FROM [ApexSQL].[MonitorMeasuredValues]
		WHERE MeasuredAt >= @StartDate
			AND MeasuredAt <= @EndDate
			AND MeasurementId = @MeasurmentId
			AND SourceId = @SourceId
		GROUP BY ApexSQL.FGetDateDiff(MeasuredAt, [ApexSQL].[CalculateInterval](@StartDate, @EndDate, @Interval))
		)
GO
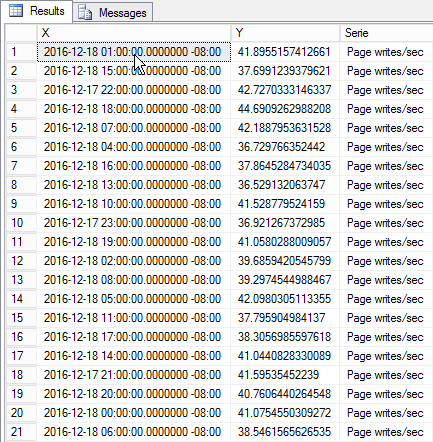
MeasuredValueMultiLineChart function – returns the X(Time),Y(Value),Serie(Name of metric)
This is the function that will read the data for creating the charts with more than one metric. This function will return the name of the metric alongside with the value of the metric and the date/time when the metric is collected. This will allow displaying the different metric lines in the chart where metric name can be used as the identifier for the specific series of data (metric name will identify the chart data line)
Example call: The function is designed to be used as part of the select statement in the final report query for retrieving the requested data from the repository database
SELECT X,Y,Serie FROM [ApexSQL].[MeasuredValueMultiLineChart](
    ApexSQL.SourceNameToId(@ServerName),
    ApexSQL.MetricNameToId('Page writes/sec'),
    @StartDate,
    @EndDate, 0)
Parameters:
@SourceId – Unique ID of the metrics source
Type: uniqueidentifier
@MeasurmentId – Unique Id of the performance metric
Type: uniqueidentifier
@StartDate – Start period of the required metric data
Type: datetimeoffset
Form: ‘2016-11-01 00:00:00.0000000 +01:00,
@EndDate – End period of the required metric data
Type: datetimeoffset
Form: ‘2016-11-01 00:00:00.0000000 +01:00
@Interval – Interval in minutes that will be used to feed the the CalculateInterval helper function for calculation. By default, the value is set to 0. For more information on this, please refer to Calculate default interval – [ApexSQL].[CalculateInterval] helper function in the “ApexSQL Monitor ad hoc reporting Helper functions inventory, descriptions and examples” KB article
Type: integer
Example result:
Defintion:
CREATE FUNCTION [ApexSQL].[MeasuredValueMultiLineChart] (
	@SourceId UNIQUEIDENTIFIER
	,@MeasurmentId UNIQUEIDENTIFIER
	,@StartDate DATETIMEOFFSET
	,@EndDate DATETIMEOFFSET
	,@Interval INT = 0
	)
RETURNS @result TABLE (
	X DATETIMEOFFSET NOT NULL
	,Y FLOAT NOT NULL
	,Serie NVARCHAR(256)
	)
AS
BEGIN
	DECLARE @serie NVARCHAR(256);

	SELECT @serie = [ApexSQL].[MetricIdToName](@MeasurmentId)

	INSERT INTO @result
	SELECT MAX(ApexSQL.FTruncateDate(MeasuredAt, [ApexSQL].[CalculateInterval](@StartDate, @EndDate, @Interval))) AS X
		,AVG(Value) AS Y
		,MAX(@serie) AS Serie
	FROM [ApexSQL].[MonitorMeasuredValues]
	WHERE MeasuredAt >= @StartDate
		AND MeasuredAt <= @EndDate
		AND MeasurementId = @MeasurmentId
		AND SourceId = @SourceId
	GROUP BY ApexSQL.FGetDateDiff(MeasuredAt, [ApexSQL].[CalculateInterval](@StartDate, @EndDate, @Interval))
	ORDER BY X

	RETURN
END
GO
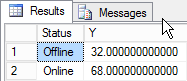
MeasuredValuePieChart – Returns pie chart data X(Type),Y(%)
This function could be used wherever is required to provide the pie-chart for status data or metrics. The function will perform all data processing and will return data in for of the percentage of the total value for all status states of the metric
Example call: The function is designed to be used as part of the select statement in the final report query for retrieving the requested data from the repository database
SELECT ApexSQL.StatusConverter(X) AS STATUS ,Y FROM [ApexSQL].SELECT ApexSQL.StatusConverter(X) AS STATUS,Y FROM [ApexSQL].[MeasuredValuePieChart](ApexSQL.SourceNameToId(@MachineName), ApexSQL.MetricNameToId('System availability'), @StartDate, @EndDate)[MeasuredValuePieChart](
ApexSQL.SourceNameToId(@MachineName),
ApexSQL.MetricNameToId('System availability'),
@StartDate,
@EndDate)
Parameters:
@SourceId – Unique ID of the metrics source
Type: uniqueidentifier
@MeasurmentId – Unique Id of the performance metric
Type: uniqueidentifier
@StartDate – Start period of the required metric data ** FROM
Type: datetimeoffset
Form: ‘2016-11-01 00:00:00.0000000 +01:00
@EndDate – End period of the required metric data
Type: datetimeoffset
Form: ‘2016-11-01 00:00:00.0000000 +01:00
Example result:
Defintion:
CREATE FUNCTION [ApexSQL].[MeasuredValuePieChart] (
	@SourceId UNIQUEIDENTIFIER
	,@MeasurmentId UNIQUEIDENTIFIER
	,@StartDate DATETIMEOFFSET
	,@EndDate DATETIMEOFFSET
	)
RETURNS TABLE
AS
RETURN (
		SELECT Value AS X
			,count(*) * 100.0 / SUM(count(*)) OVER () AS Y
		FROM [ApexSQL].[MonitorMeasuredValues]
		WHERE MeasuredAt >= @StartDate
			AND MeasuredAt <= @EndDate
			AND MeasurementId = @MeasurmentId
			AND SourceId = @SourceId
		GROUP BY [Value]
		)
GO
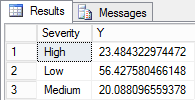
Alert severity pie chart
This is alerts specific function to be used wherever is required to provide the pie-chart for alerts data. The function will perform all data processing and will return data as the percentage of the total value for all alerts severities
Example call: The function is designed to be used as part of the select statement in the final report query for retrieving and calculating the requested data from the repository database
SELECT ApexSQL.AlertSeverityToStringConverter(X) AS Severity,Y
FROM [ApexSQL].[AlertSeverityPieChart](
    @StartDate,
    @EndDate,
    @MachineName)
Parameters:
@StartDate – Start period of the required metric data ** FROM
Type: datetimeoffset
Form: ‘2016-11-01 00:00:00.0000000 +01:00
@EndDate – End period of the required metric data
Type: datetimeoffset
Form: ‘2016-11-01 00:00:00.0000000 +01:00
@SourceId – Unique ID of the metrics source
Type: uniqueidentifier
Example result:
Defintion:
CREATE FUNCTION [ApexSQL].[AlertSeverityPieChart] (
	@StartDate DATETIMEOFFSET
	,@EndDate DATETIMEOFFSET
	,@SourceId UNIQUEIDENTIFIER
	)
RETURNS TABLE
AS
RETURN (
		SELECT Severity AS X
			,count(*) * 100.0 / SUM(count(*)) OVER () AS Y
		FROM [ApexSQL].[MonitorAlerts]
		WHERE TimeRaised >= @StartDate
			AND TimeRaised <= @EndDate
			AND SourceId IN (
				SELECT *
				FROM ApexSQL.GetAllSourcesForMachine(@SourceID)
				)
		GROUP BY [Severity]
		)
Downloads
Please download the script(s) associated with this article on our GitHub repository.
Please contact us for any problems or questions with the scripts.


