Applies to:
Summary
This article provides an in-depth look into the automations process of the SQL manage instance tool features.
Description
In today’s ever-growing world of technology, there is a constant need for comfort, a constant pursuit for simplicity. We often ask ourselves how to make things simpler, faster and how to, as much as possible, reduce human effort thus increasing the overall performance and productivity.
The following topic tries and, to an extent, succeeds in providing the answers to the above fired questions, at least regarding the SQL manage instance tool, as it provides an in-depth look into the automation process of application main features making the interaction with the tool fun and simple.
All the main features of the software are already well described and this valuable content can be found in the following Knowledgebase page. Pick your preferred topic to quickly get familiar with the tool.
It’s worth noting that all this automation process wouldn’t be possible without the help of the ApexSQL Manage Agent, the mighty windows service that runs in background and makes the magic happen. It allows the application to execute scheduled tasks, and to notify the user about the execution time of those tasks along with the results of its outcomes.
To install this service properly and with the right permissions, see the ApexSQL Manage permissions and requirements article.
With that out of the way, let’s cover the automation process for one of the features.
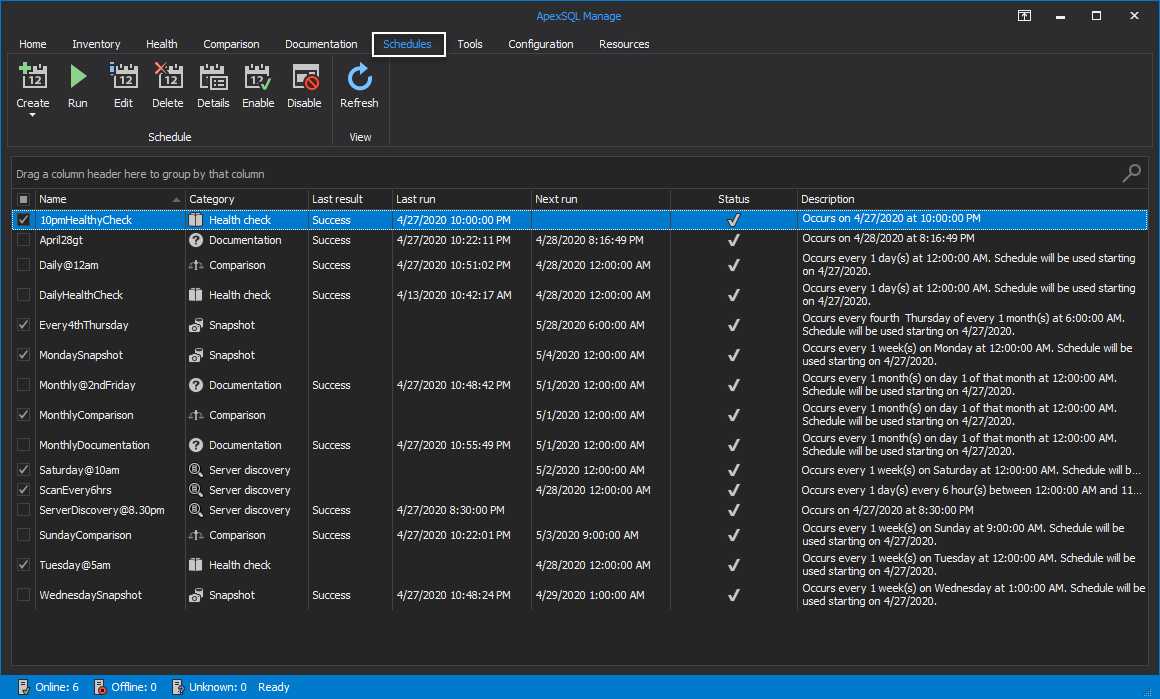
First, head over to the Schedules tab of the SQL manage instance application:
Here, click the Create drop-down button and choose a task to schedule:
- Server discovery – scan in search for SQL Server instances and SSRS, SSAS, SSIS services
- Health check – provide high level analysis of discovered instances
- Comparison – compare SQL Server instances and snapshots
- Documentation – document SQL Server instances and snapshots
- SQL Server snapshot – create snapshots for discovered SQL Server instances
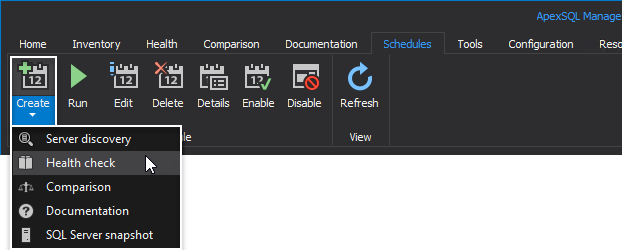
For this guide, let’s choose to automate Health check operation. This operation will run a high level analysis on the selected SQL Server instance in search for its health check issues and will return the results via an email notification.
After selecting the matching option from the Create drop-down list, the Health check window will be opened:
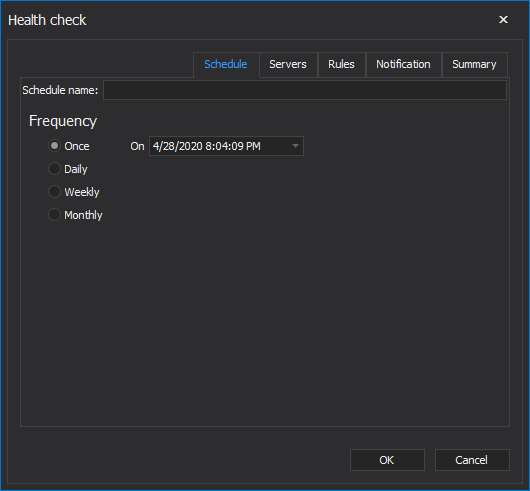
Under the Schedule tab, first provide the name for the schedule:

The next step will be to set the desired task frequency under the Frequency area.
There are four different types of schedule in the SQL manage instance tool:
- Once,
- Daily,
- Weekly or
- Monthly
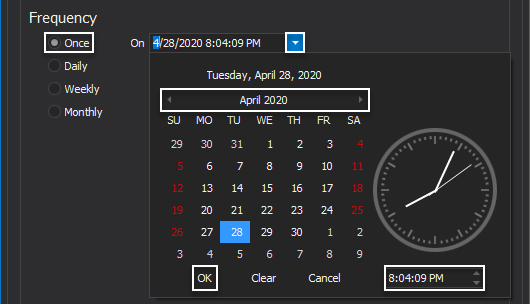
To schedule the task to execute only one time, choose the Once option and click the drop-down button in the On date/time selection box. This action will open the calendar where current month is displayed in form of the week days. Slide left for previous or right for the next month. Select the day from the calendar, set the exact time from the bottom right corner of the calendar and confirm selection by clicking the OK button:
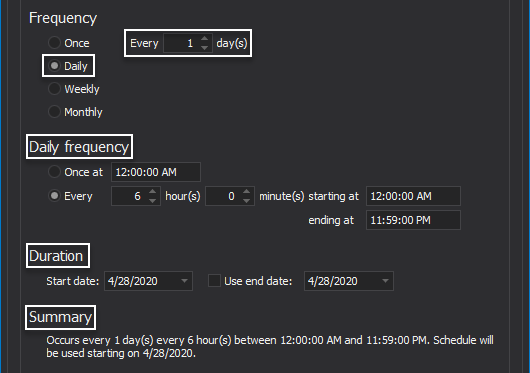
The Daily option allows the every day automation. Choose to execute the task every day or every “x” number of days. Under the Daily frequency set it once at desired time or to execute every “x” number of hours with starting and ending time. Set the start and the end date for the schedule under the Duration area.
Under the Summary section, the info about chosen schedule parameters is presented.
For instance, the following schedule will be executed every day for every 6 hours between 12am and 11:59pm:
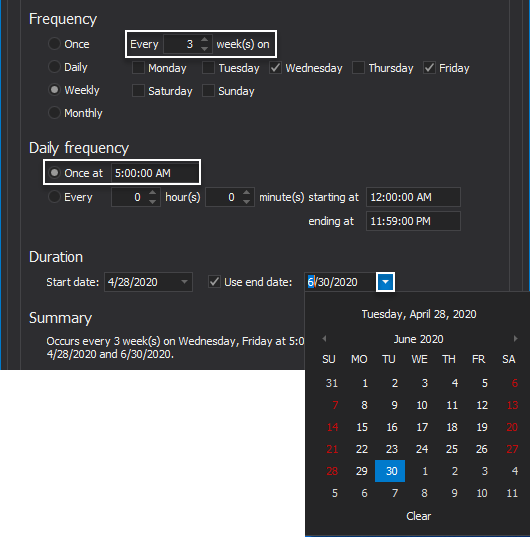
The Weekly schedule has its own set of proprietary settings. For example, schedule the task to run every 3rd week on Wednesday and Friday at 5am up until the June 30, 2020, like presented on the following image:
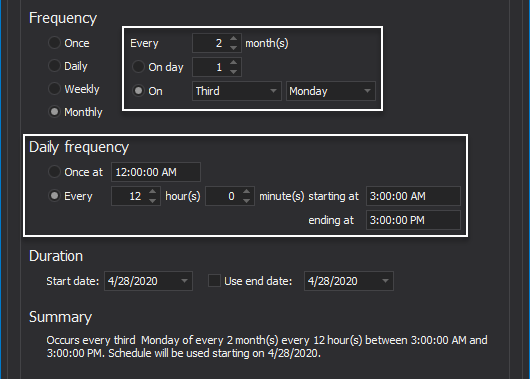
And lastly, when the Monthly schedule is selected there is an option to run it every “x” number of months, on a specific day of the month, etc… The other settings are previously covered:
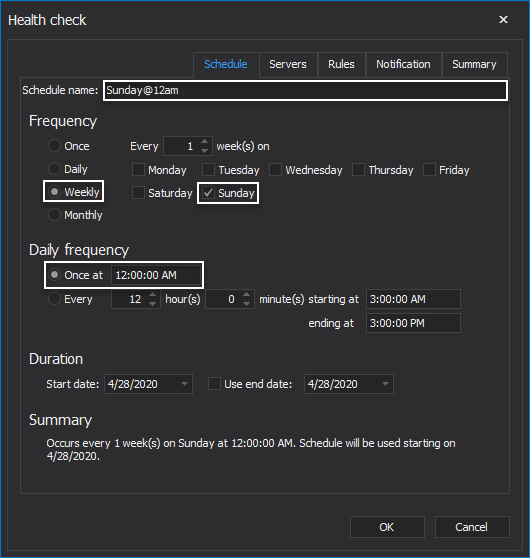
For the sake of this article, let’s schedule the health check job to run every Sunday at 12am without setting the end date:
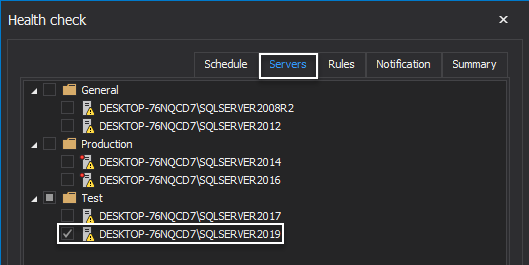
Under the Servers tab choose the SQL Server(s) to run the health check analysis against:
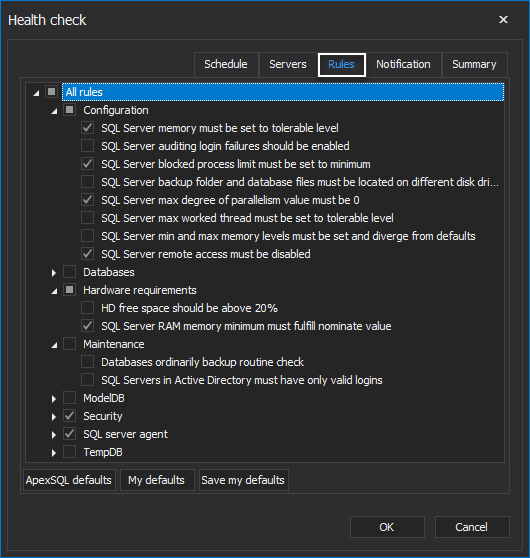
The Rules tab allows the different set of rules to be included into the upcoming analysis. All of them are grouped into the following categories:
- Configuration
- Databases
- Hardware requirements
- Maintenance
- ModelDB
- Security
- SQL Server agent
- TempDB
Choose the preferred set of rules and head over to the Notification tab:
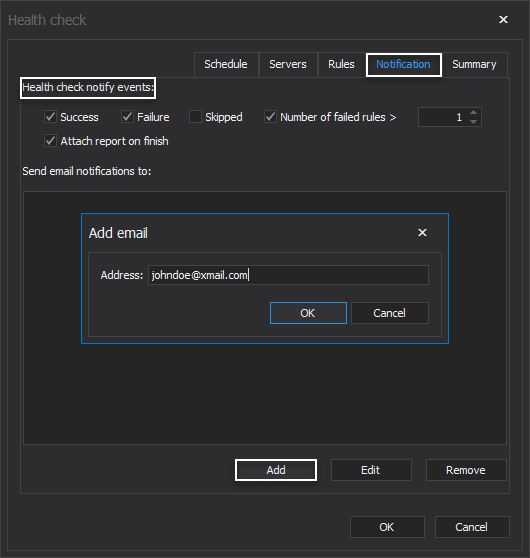
Under the Health check notify events of the Notification tab choose to be notified on:
- Success,
- Failure
- Skipped
- Number of failed rules
Additionally, there is a neat option to add the report of job results along with the email.
Simply check the Attach report on finish box and provide email by clicking the Add button:
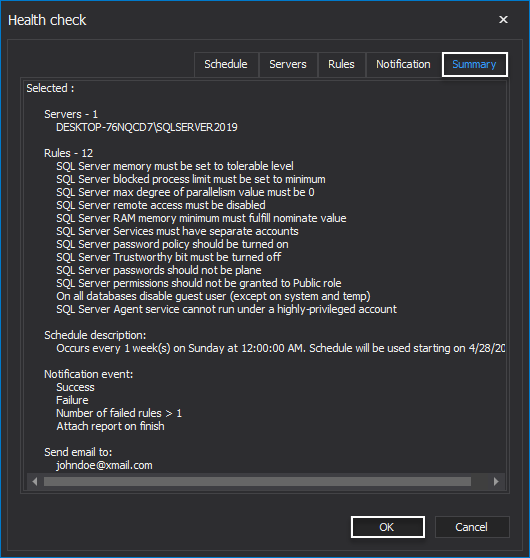
The Summary tab displays the chosen parameters for the scheduled task within the SQL manage instance software. Click the OK button to create the schedule:
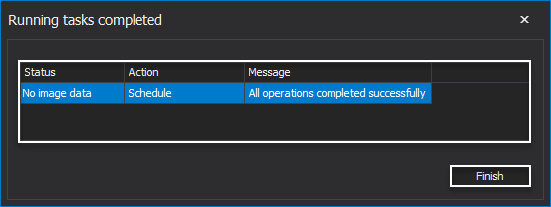
Running tasks completed window will open stating that schedule is successfully created. Click the Finish button to exit the setup:
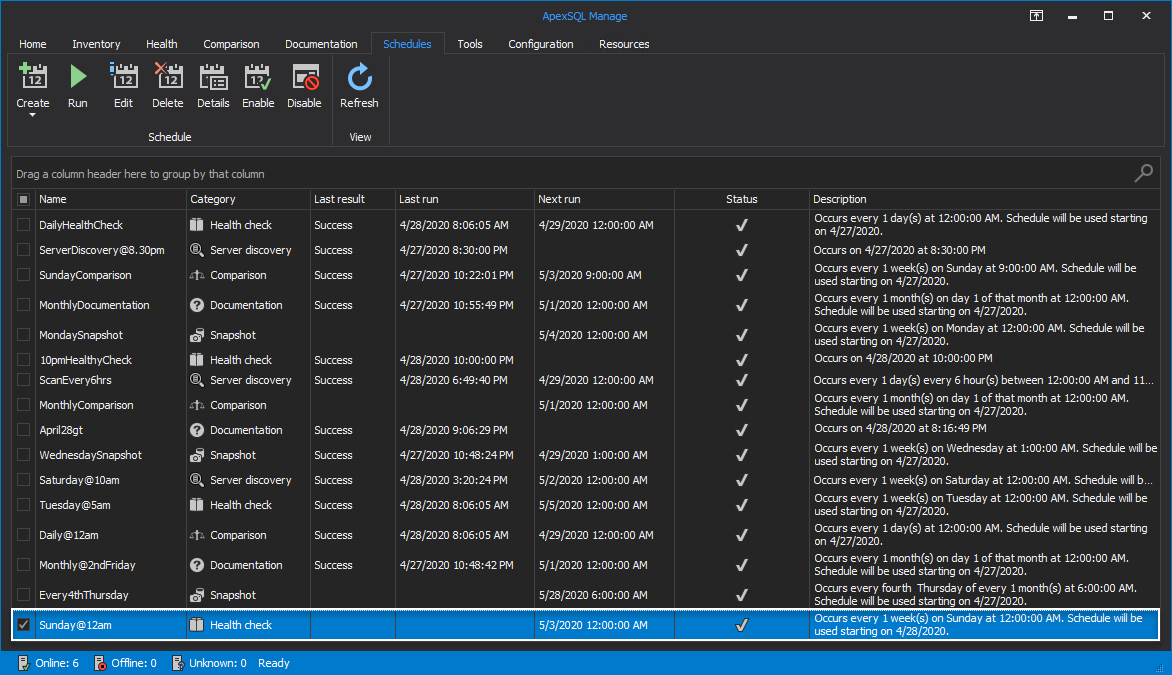
This newly created schedule is listed in the main grid of the Schedules tab and is waiting it’s execution time that is previously set. All the schedule details is displayed in the following columns:
- Name – the name of the schedule
- Category – the category schedule belongs to
- Last result – the result of the last execution: success or failure
- Last run – date and time of the last run
- Next run – date and time of the next run
- Status – current status of the schedule: enabled or disabled
- Description – the execution schedule
Additionally, the SQL manage instance schedules can be later edited, deleted, enabled or disabled by clicking the corresponding button:

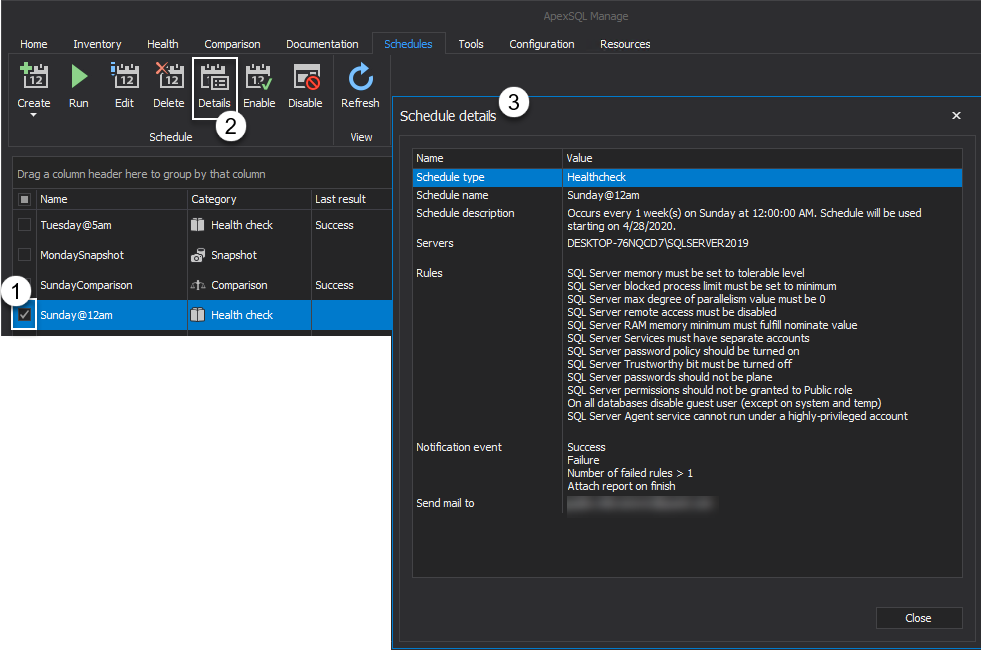
To view the details of the schedule, select it from the grid and click the Details button:
To run the schedule manually and outside of its execution time frame, check it from the grid and click the Run button:
Immediately upon executing the schedule, the notification will be sent to the provided email. All details based on the chosen schedule parameters will be shown:
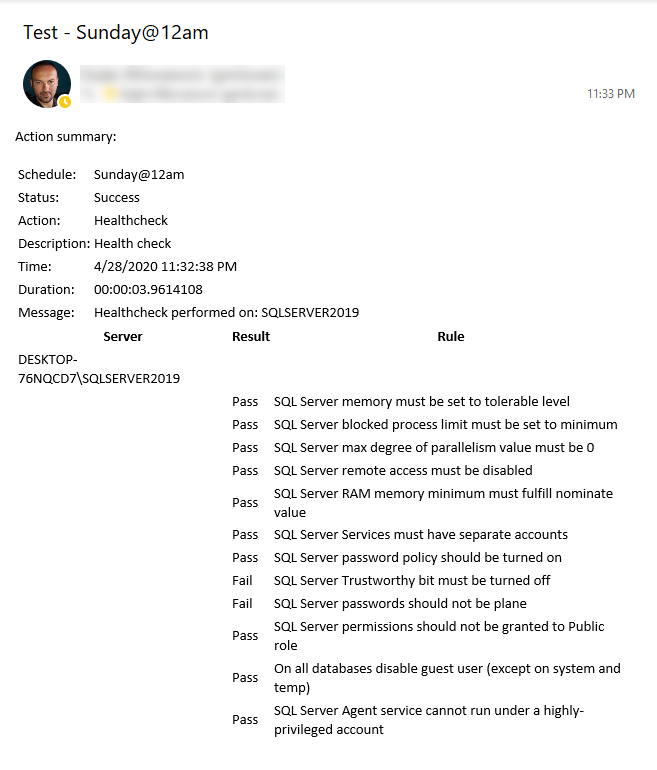
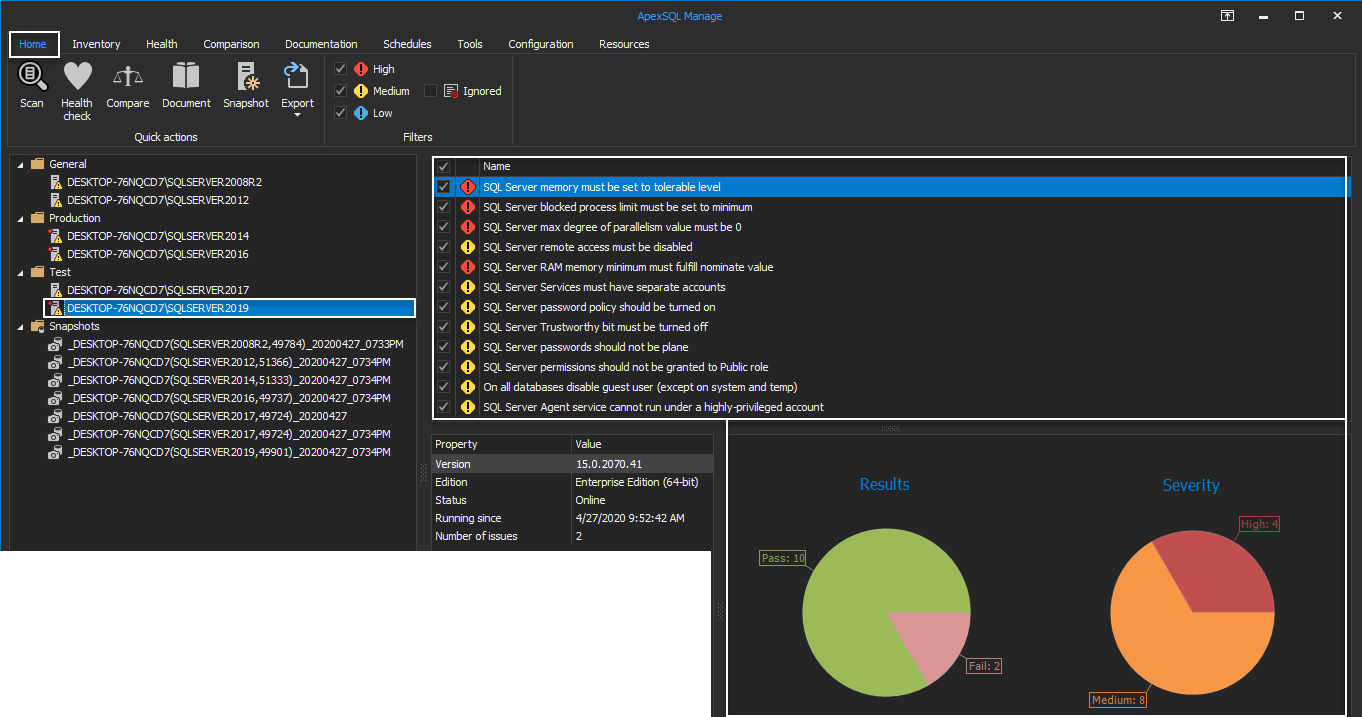
Additionally, the results of the performed health check analysis for the selected SQL Server can be viewed under the Home tab of the SQL manage instance application in a form of a severity for every executed rule along with the graphic:
This automation process will surely help a portion of DBA’s everyday tasks simpler and more productive.


