


Applies to
Summary
This article explains how to check SQL auditing status and interpret the shown information.
Description
Finding quick info about current SQL auditing status for both, central repository, and audited SQL Server instances, is optimized by placing this info in a centralized manner without the necessity to browse around application GUI to gather it. This article explains where the most important information is located, what does it contain and what activities are recommended based on the information.
Status information
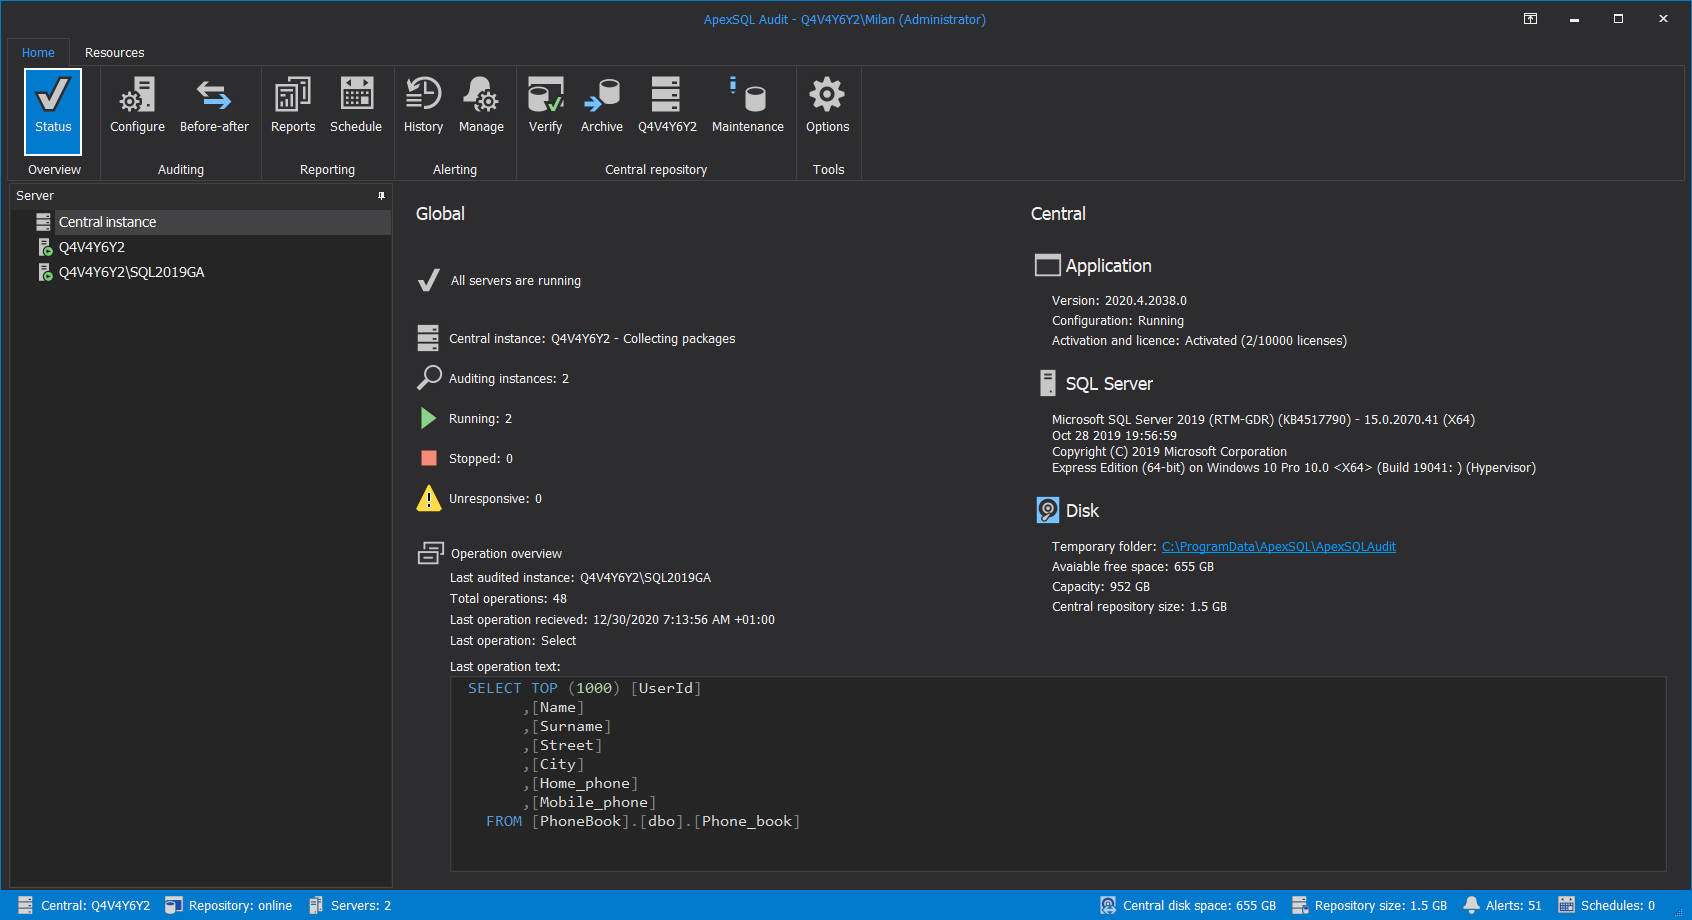
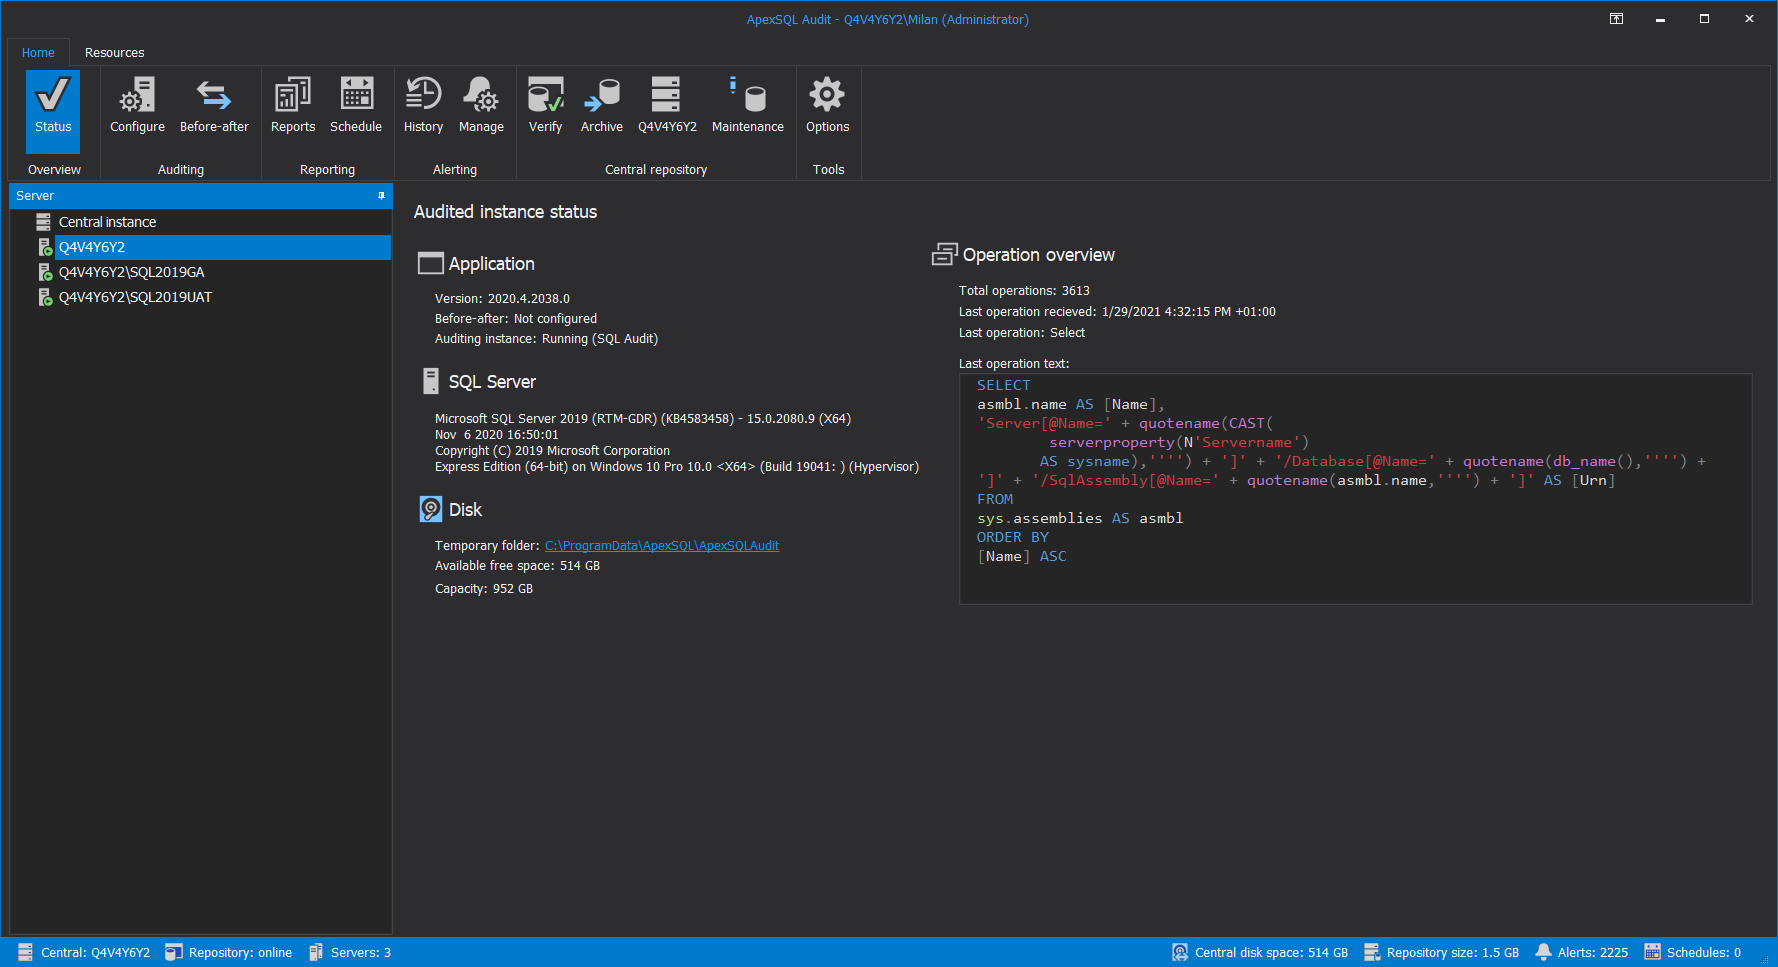
All relevant information about the current SQL auditing status can be found in the Status tab of the main ApexSQL Audit GUI. This tab will be shown by default when the application GUI is started:
The status information will be separated for the central instance and every other audited instance, and can be accessed by clicking the item named “Central instance” in the Server list in the left panel and for the audited instances by clicking on their respective names in the same list:
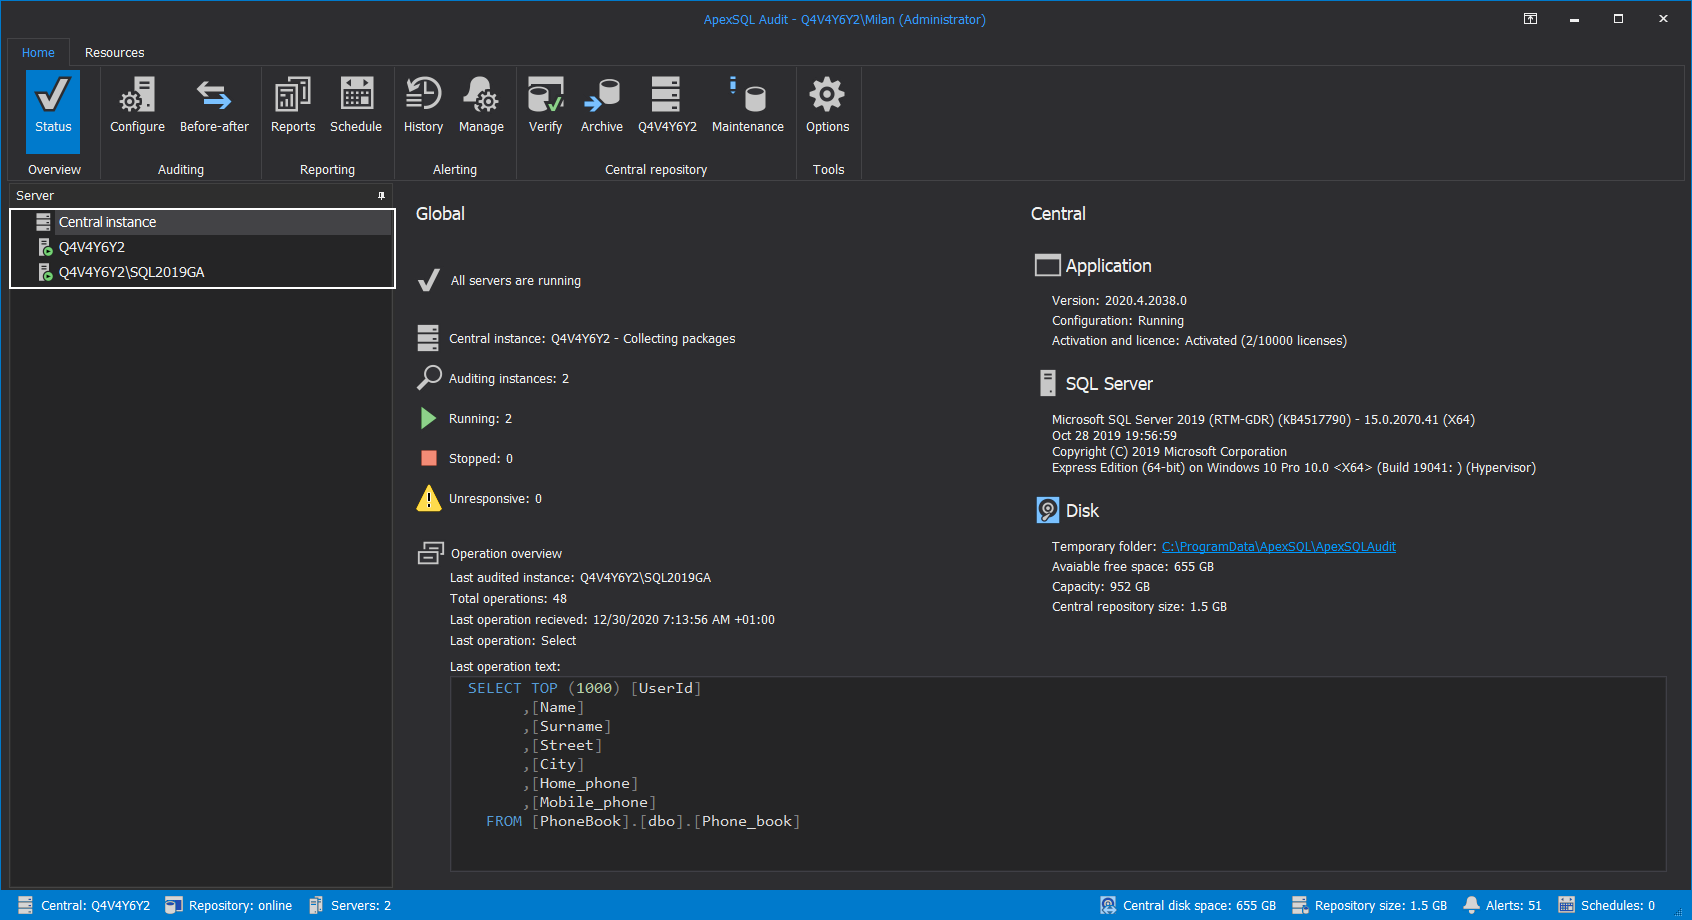
Additional status regarding the central repository database (hosting SQL Server, database size, storage size, total number of audited instances) can be found in the status bar at the bottom:
This status bar is always visible regardless of the current tab.
Central instance
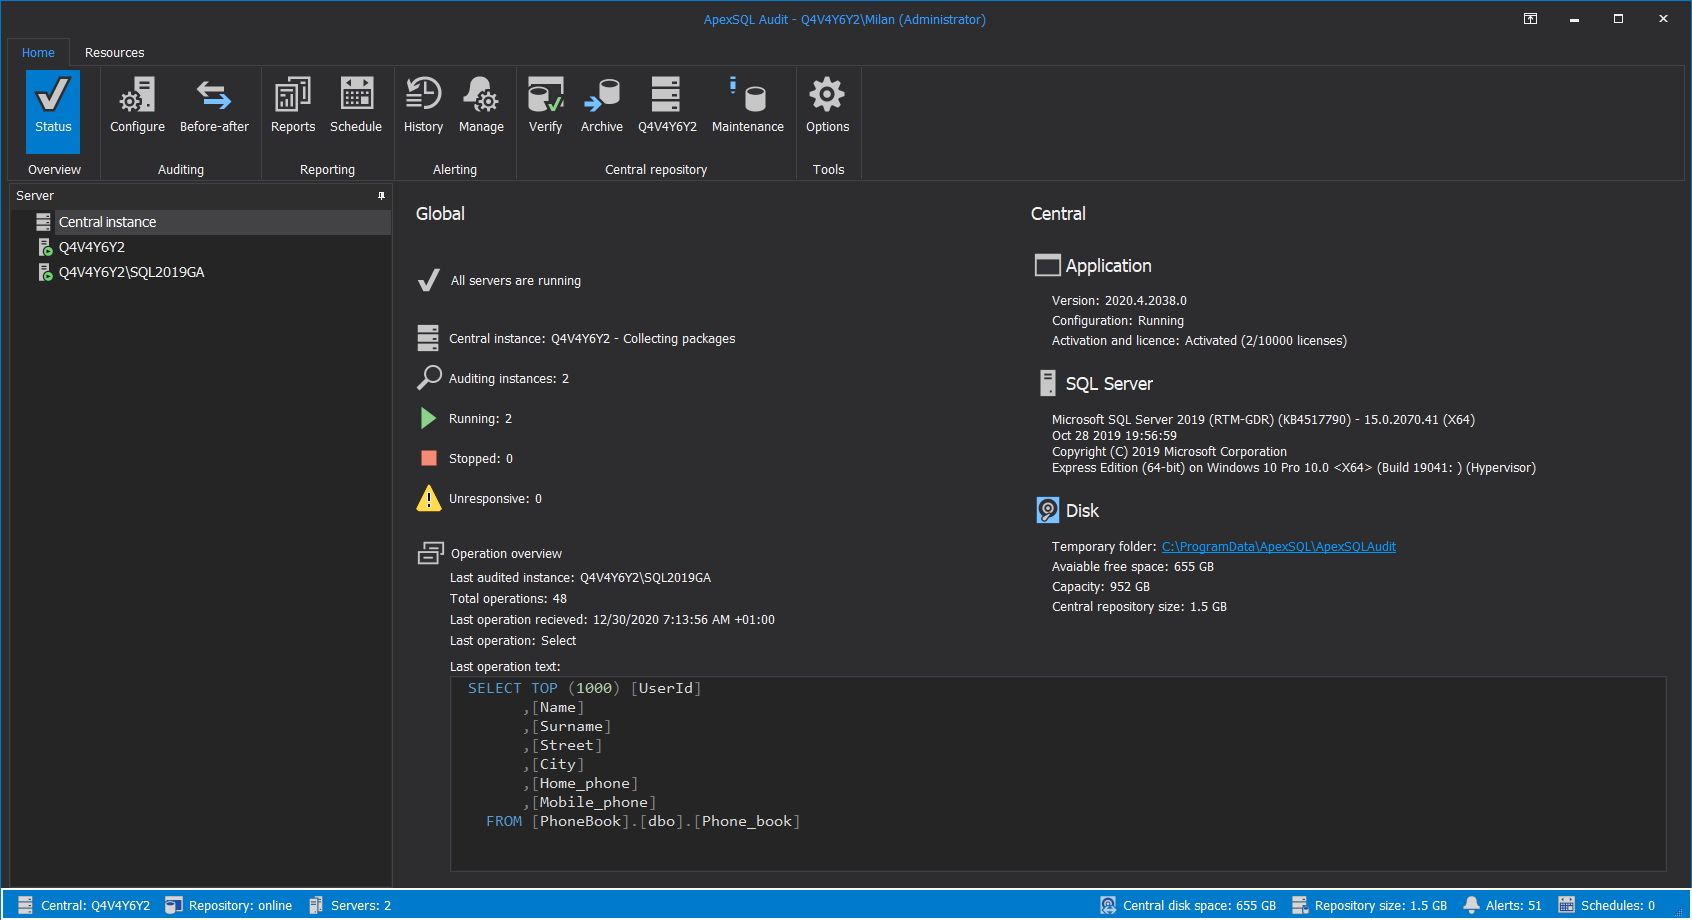
As previously explained, the central instance status will be shown by default when the GUI is started and the status will be aggregated in two distinctive sections, Global and Central sections.
The Global section provides status regarding the relationship with audited instance and from the top to bottom the status items are:
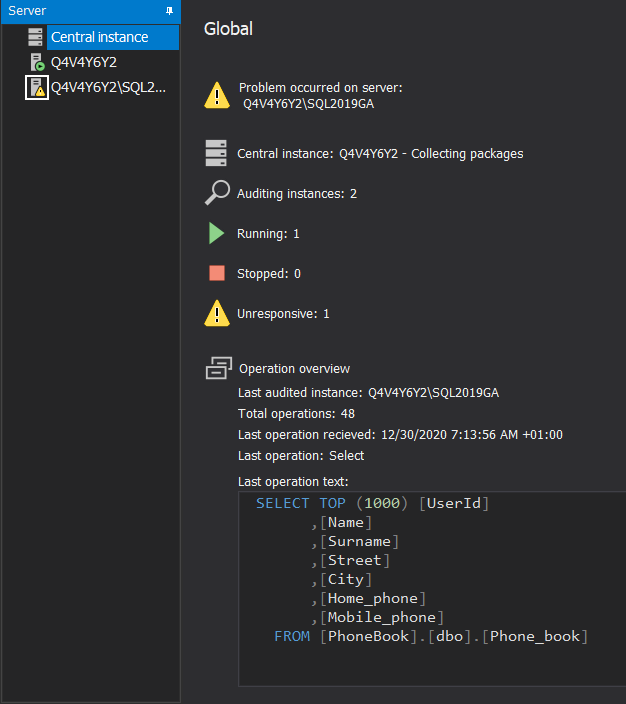
- Audited SQL Server availability information – this item will show if all instances are up and running or if some problem exists on some of the listed servers (server names with the problem will be shown here). Most of the time problems may be the result of communication lag between central instance and remote, audited instances
- Central SQL Server current status – shows if the central instance is currently gathering audited data
- Auditing instances – show the total number of audited instances related to this central instance
- Running – shows the current number of audited instances that are up and running without issues
- Stopped – shows the number of instances that have auditing stopped. If auditing was not stopped manually, it is possible that the instance is experiencing low storage space and auditing was stopped automatically by a system alert (switch to the History tab and check the alerts history to examine the issue)
- Unresponsive – shows if there is an issue with an audited SQL Server connectivity. The most common issues are network congestion and high SQL Server load (switch to the History tab and check the alerts history to examine the issue). Basically, this item will just summarize the number of audited instances experiencing issues that are listed in the Audited SQL Server availability information
- Operation overview – show current dynamics of data collected from audited instances, e.g. which instance was last to send data, what amount of events from that instance was captured so far, timestamp and the type of last observed operation, and below all that, the SQL text data of the query that generated the event
Based on the current availability status, the icon in the Server list will be changed:
- The explanation of how some system alerts can influence the status of audited servers can be found in the article: Inventory of system alerts for SQL auditing
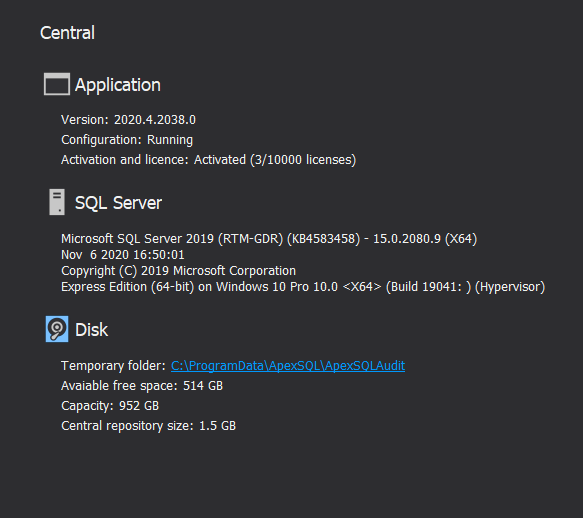
In the Central section, properties of the application and the central instance, i.e. the SQL Server hosting the repository, will be shown, and available details are:
- Application – Shows the application version, if the central repository is up and running and the number of licenses used. The number of used licenses will correspond to the number of SQL Servers added for auditing
- SQL Server – Shows details about SQL Server used to host the central repository, its version, and operational starting date, as well as OS version where the SQL Server is hosted
- Disk – Shows storage parameters used for the central instance operational folder, i.e. the temporary files location, what is the path to the location, and the disk total/free space values
Audited instances
Clicking on any item in the Server list with the label that corresponds to the audited SQL Server instance name will display the status for that instance. The information is grouped in the following manner:
- Application – Relates to the auditing agent installed on the audited SQL Server instance host (AKA remote agent). The shows basic parameters like SQL auditing technology used for data collection and the before-after auditing status. The version also relates to the agent version and it must match the main application version
- SQL Server – Show details about audited SQL Server version and edition
- Disk – Shows current location for the temporary files related to audited SQL Server and auditing agent operations (audit session data) along with the drive storage space status for that location
- More information about temporary files usage can be found in this article: SQL auditing and data flow overview with ApexSQL Audit
- Operation overview – Shows auditing dynamics for the selected instance, e.g. total operations captured since auditing started and timestamp, type and text data preview of the last operation captured. This information can be used to validate if auditing works properly by assuming that newer events should be arriving from the last recorded event
In case communication with the audited SQL Server is interrupted, instead of status the message shown on the screenshot below will appear with the link to the first troubleshooting step, i.e. to redeploy SQL auditing agent which, further on, can diagnose SQL Server availability:
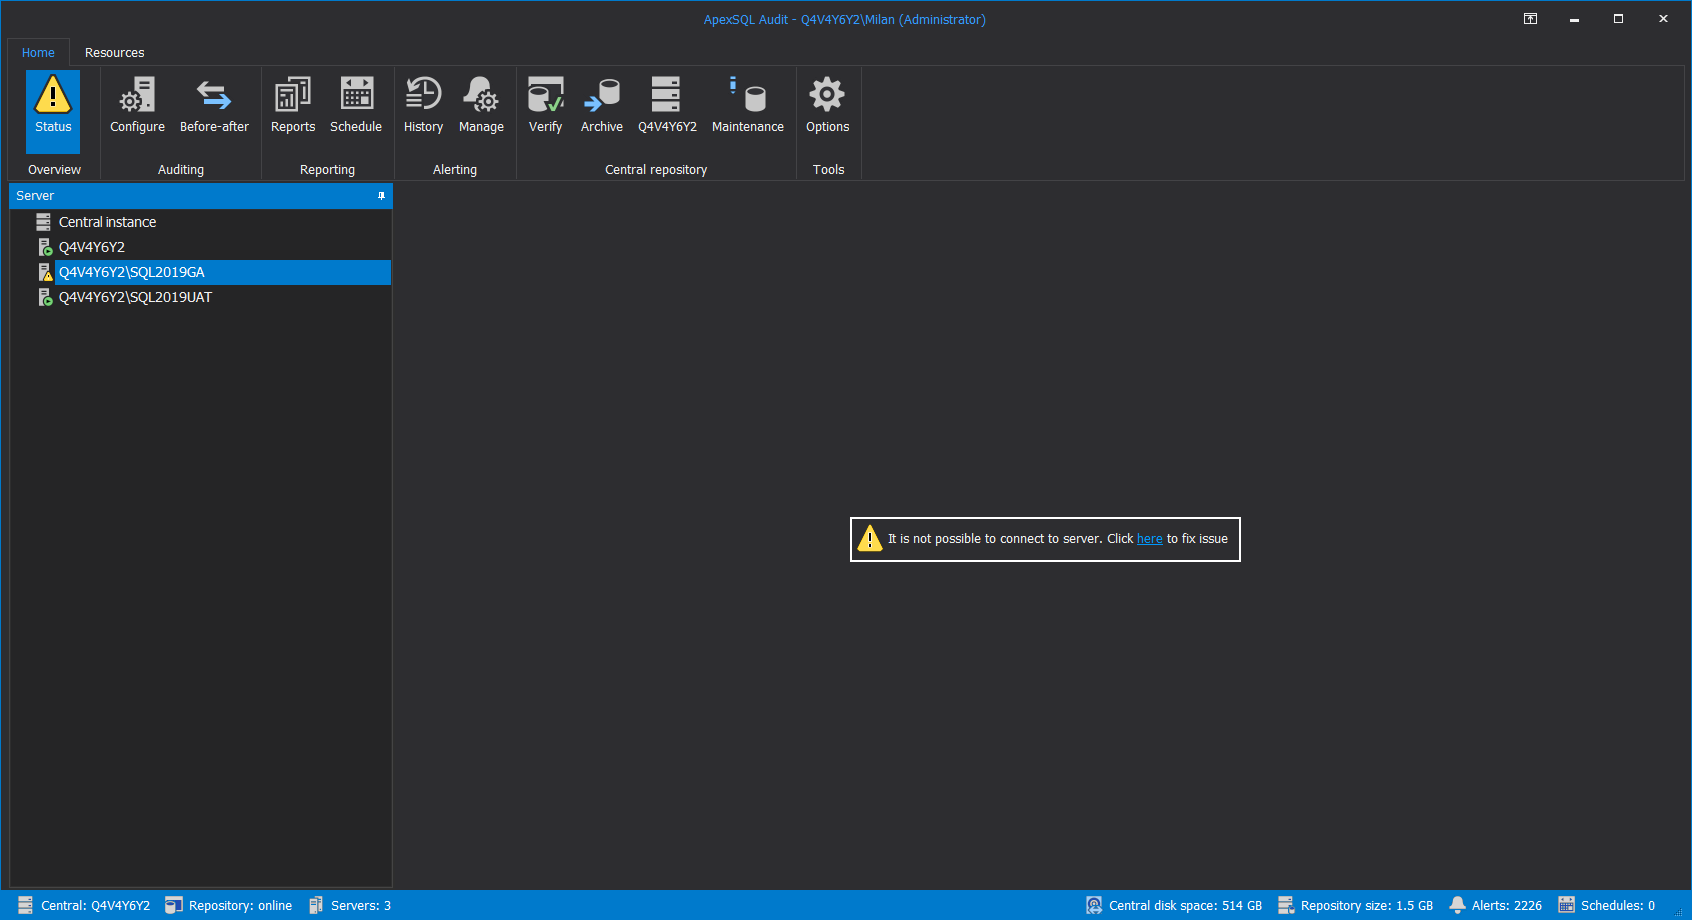
Note that due to SQL Server and network traffic congestion some of the SQL auditing information may not be shown in real-time. It is also possible, in some cases due to slow network response, that an audited instance is shown as unavailable so as a precaution before troubleshooting, it is recommended to wait for 25-30 seconds for the status to get refreshed.


