


Applies to
Summary
This article explains the usage of system-level alerts in SQL auditing environments.
Details
In complex SQL audit environments, it is always welcomed to have mechanisms that can provide real-time notifications on critical events that may or have interrupted auditing processing. Those events include low storage space, network issues, remote SQL Server inaccessibility, etc. In general, detecting system-level issues in SQL auditing and prompt notification on them is a very important step in their quick resolution.
ApexSQL Audit application includes a batch of built-in or system type alerts that enable relaying critical information in a fast and comprehensive manner. In continuation, this article will explain what those system alerts are and how they can be configured and used.
Alert management
Both system and custom alerts are managed in the same section of the application – from the Manage tab of the Alerting section in the Home menu. When opened, the tab will display a list of system alerts that are built-in in the application. Which means they will be present (and active) there from the start.
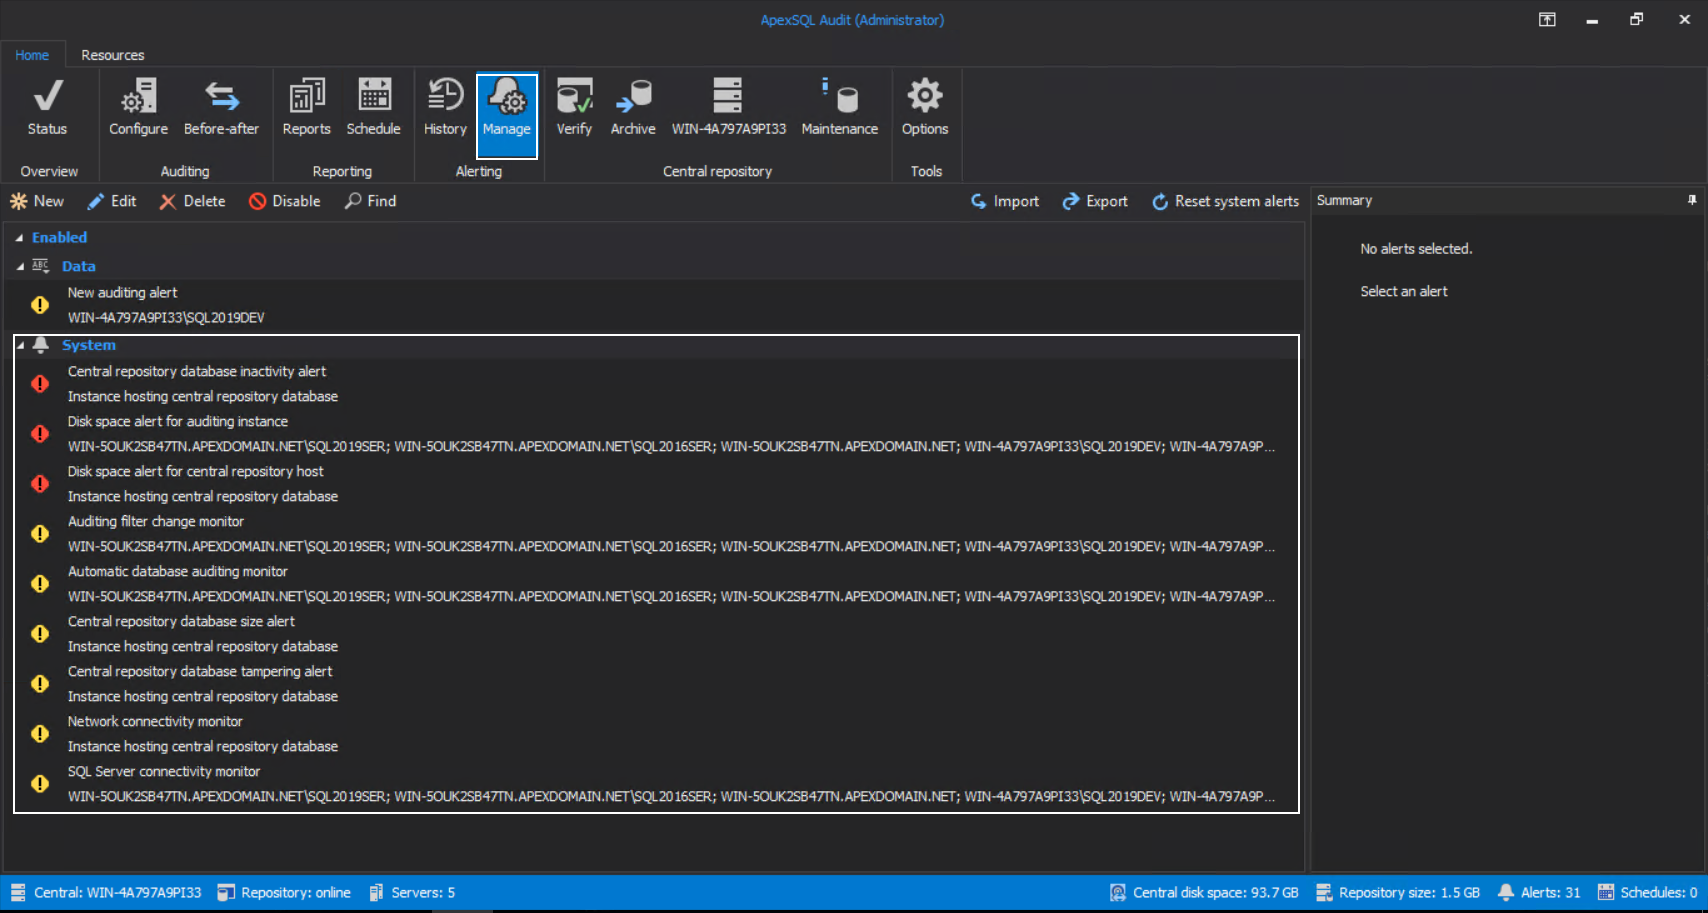
The following represents the list of available system alerts with their default severity level and ordered by severity:
- Central repository database inactivity alert
- Disk space alert for auditing instance
- Disk space alert for central repository host
- Auditing filter change monitor
- Automatic database auditing monitor
- Central repository database size alert
- Central repository database tampering alert
- Network connectivity monitor
- SQL Server connectivity monitor
The severity and other default settings can be changed, which will be explained next.
Common settings
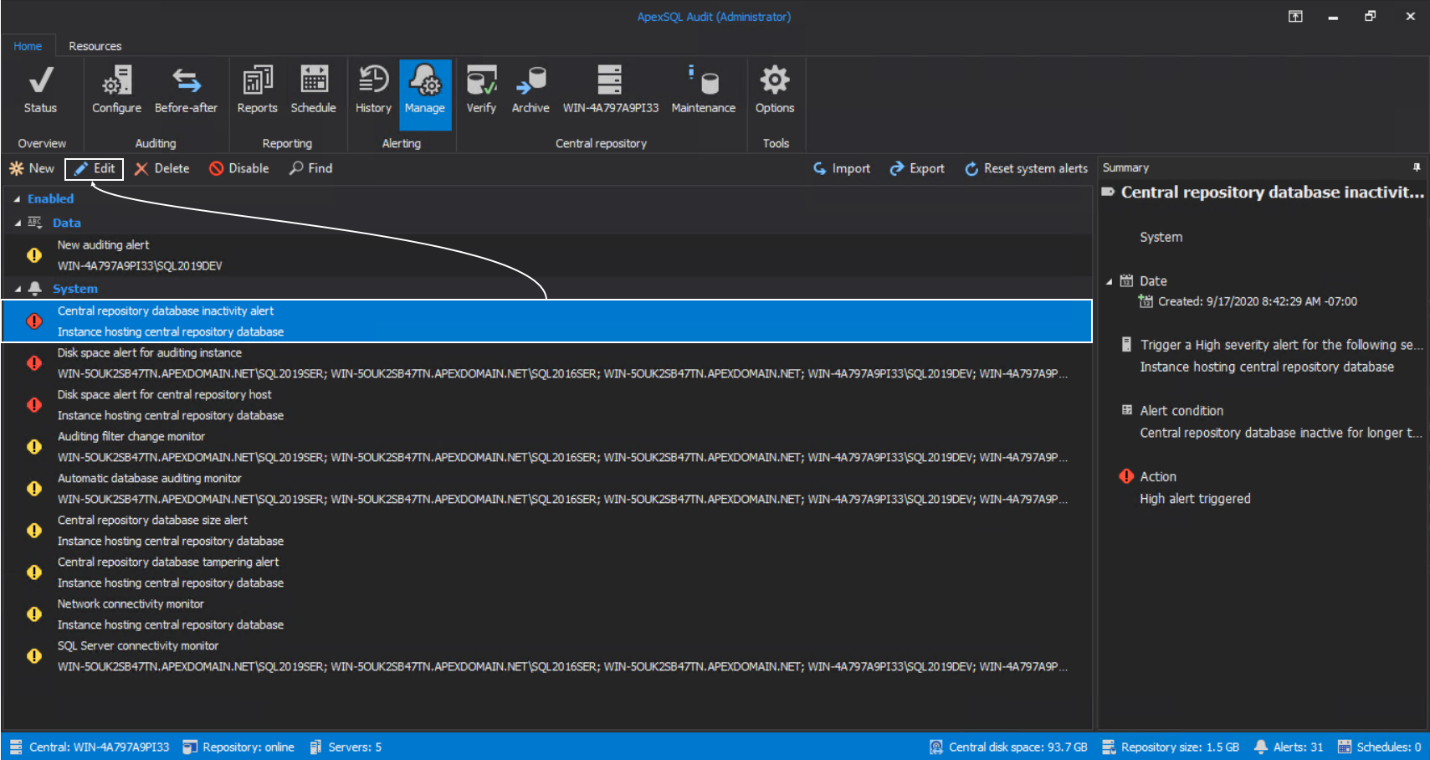
The settings for every system alert can be changed based on SQL audit requirements through a wizard type dialogue. To open the wizard, click on the item representing a system alert and click Edit:
There are several common wizard steps for every alert, and they will be explained separately in this chapter.
Alert message
This is where the message based on alert can be customized to provide the desired information. The message will be shown in the History tab of the Alerting section in the Home menu when the alert is triggered and can be displayed per audited SQL Server that alert refers to:
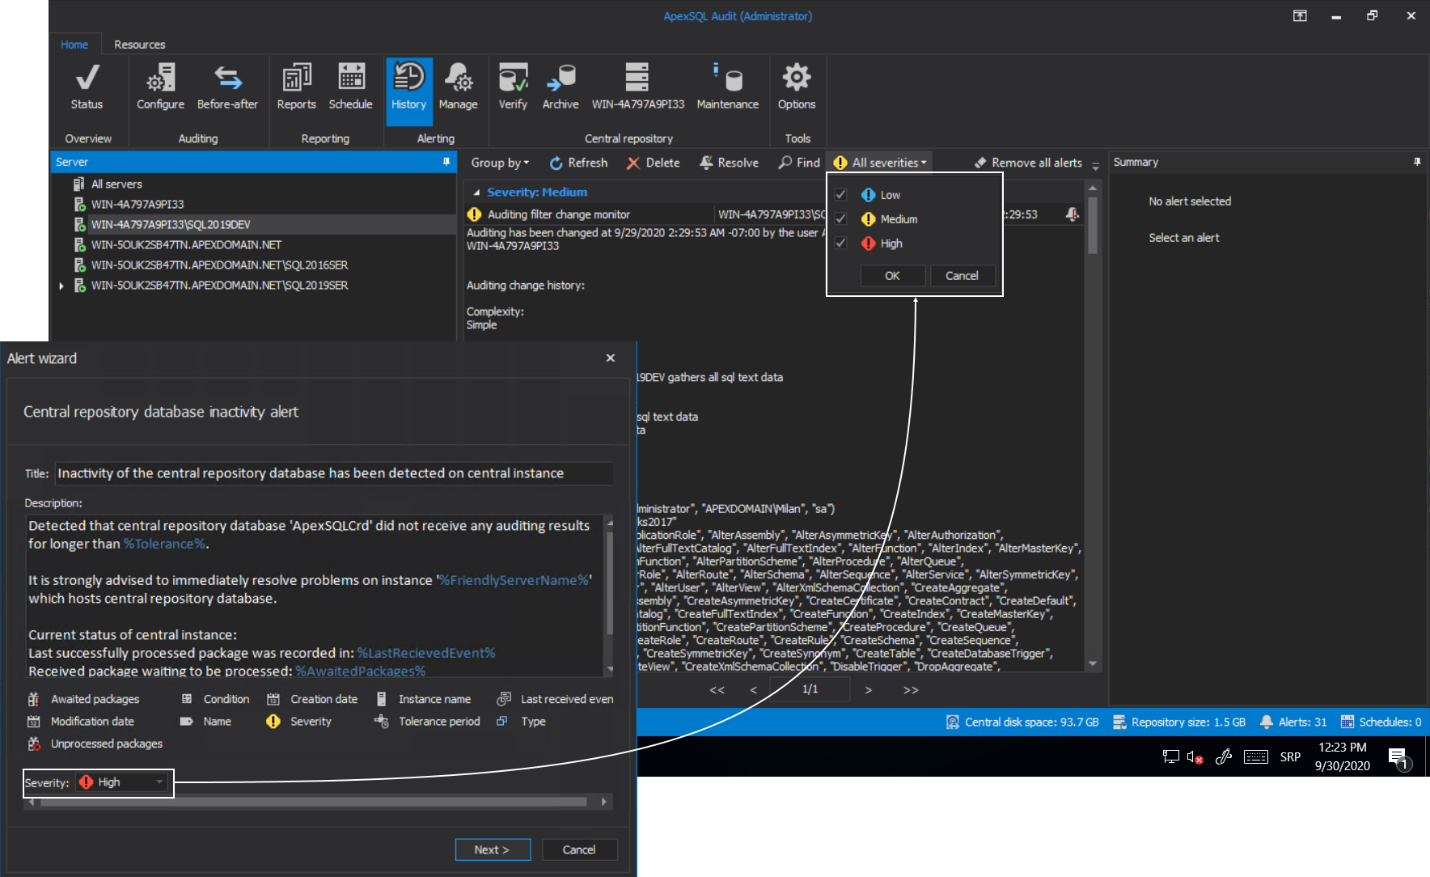
Alerts are already prepopulated with messages, but, based on requirements, more comprehensive information can be constructed using built-in, so-called, “environment variables” that will represent the value of a system element that is experiencing the issue (like the Instance name, the Unprocessed packages name…), or a system element providing general information about alert settings (like the Name of the triggered alert, Creation date…); basically, elements that can simplify the construction of the alert message and provide easy identification of the issue:
In this wizard step, the severity level can also be changed, which can influence how the issue should be perceived and filtered during a review:
The text will be used for the email body when the email notification option is used.
Email notification
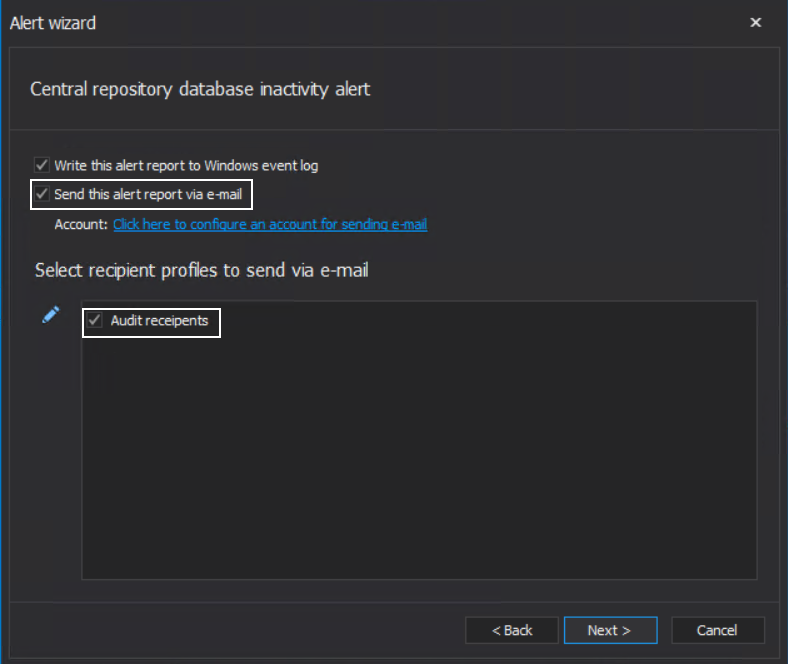
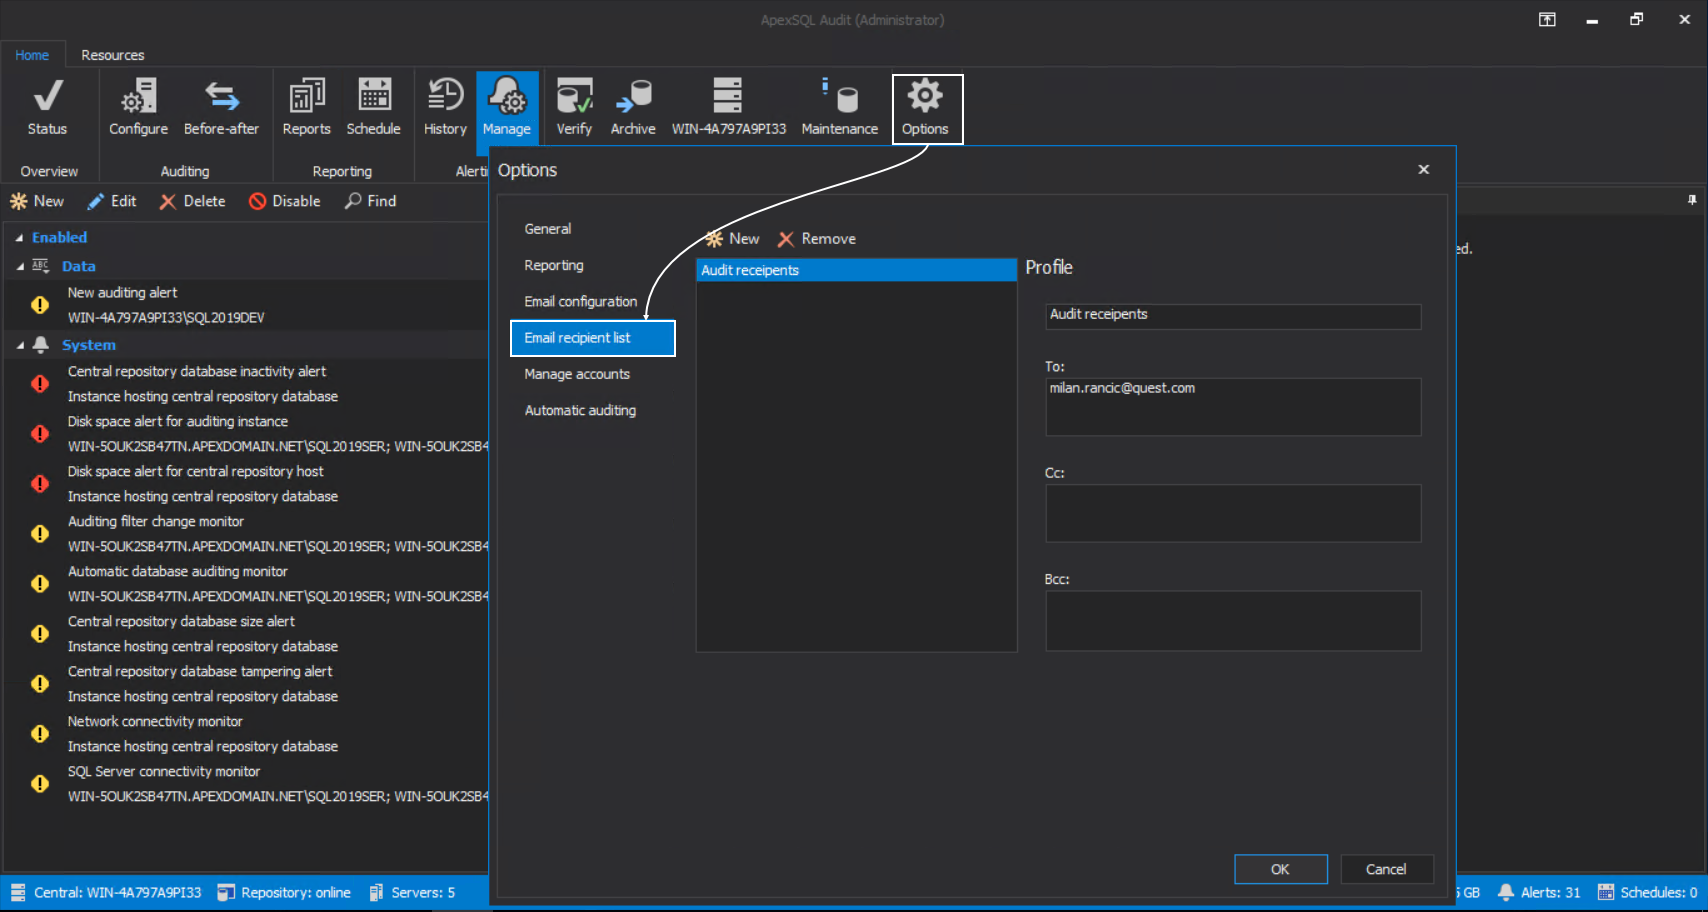
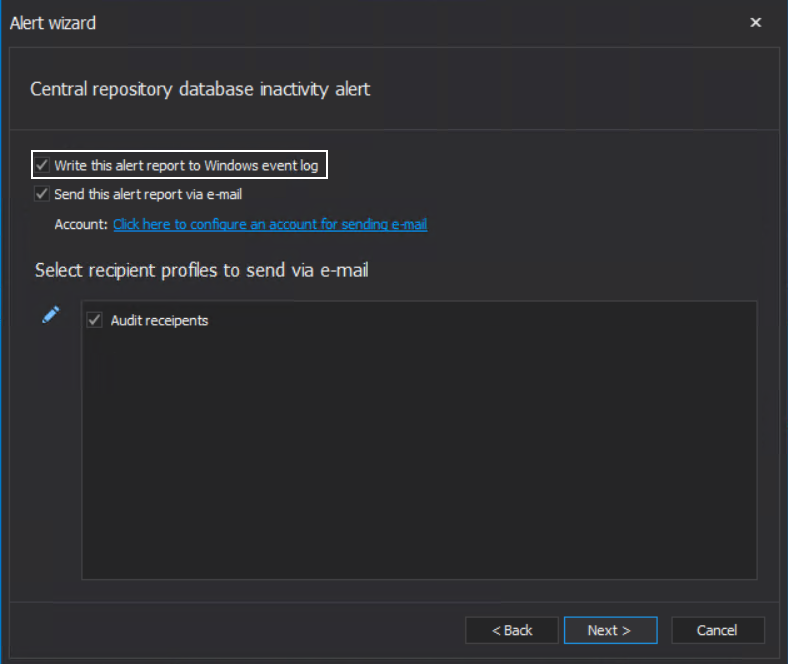
Every alert type has the option to set email notifications. By default, email notifications are disabled, enabling the option will provide a list of email profiles that define the list of recipient email addresses that will receive notification:
Email profiles can be configured in the Email recipient list tab of the Options window:
By default, the Write this alert report to Windows event log option is turned on:
This can be used to store alerts on alternate location and possibly create an automated response and issue resolution like the one explained in the article: Managing low storage space using SQL audit tool features and automation
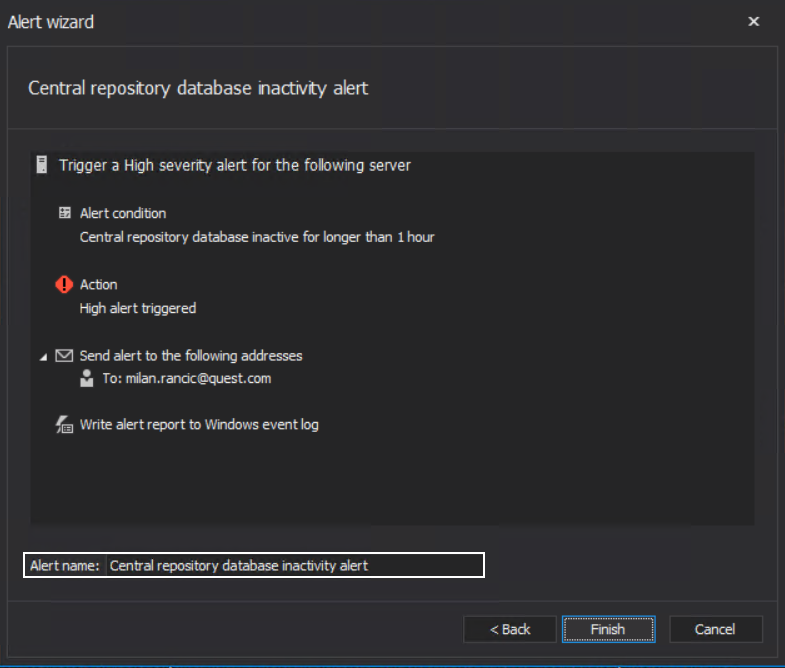
The final common wizard step for system alerts would be the summary, which allows a review of the alert configuration before applying it. The alert name can be changed here:
Along with these common wizard steps, every alert has some additional steps based on alert type to reconfigure the alert behavior, i.e., change the alert triggering threshold.
System alerts
Central repository database inactivity alert
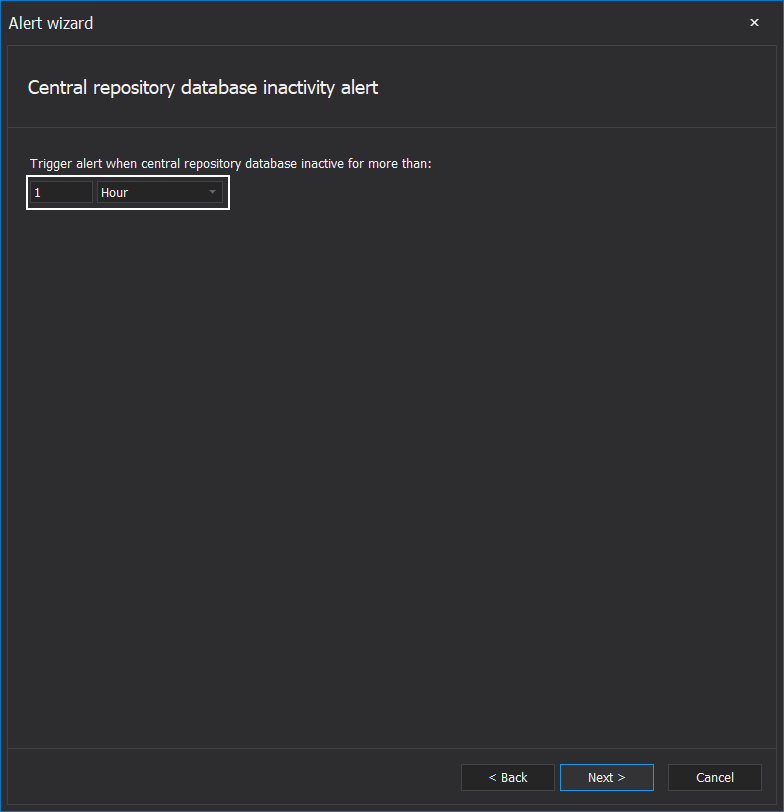
This alert type will be triggered if no SQL audited events are being written in the repository for some period. This can be the indicator of several issues: something is wrong with the central repository database, SQL Server or machine that is hosting it are having network connectivity issues (audited SQL Servers are not connected anymore), or simply, SQL auditing filters are not applied properly, and the application is monitoring some rare, insignificant events. Since SQL activity may vary from one environment to another, customizing the period is available as the step in this alert’s wizard configuration. Options include the number of time units and the type of time units:
The alert message will provide information on when the last event was recorded and how many unprocessed and processed packages are still in the queue.
Disk space alert for auditing instance
When a SQL Server is added for auditing, the auditing agent configuration will offer to designate a storage location for temporary files:
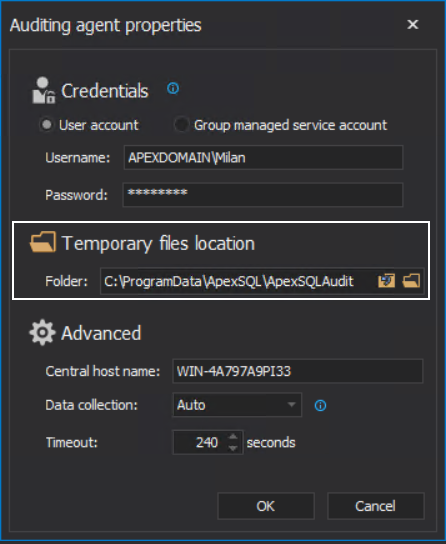
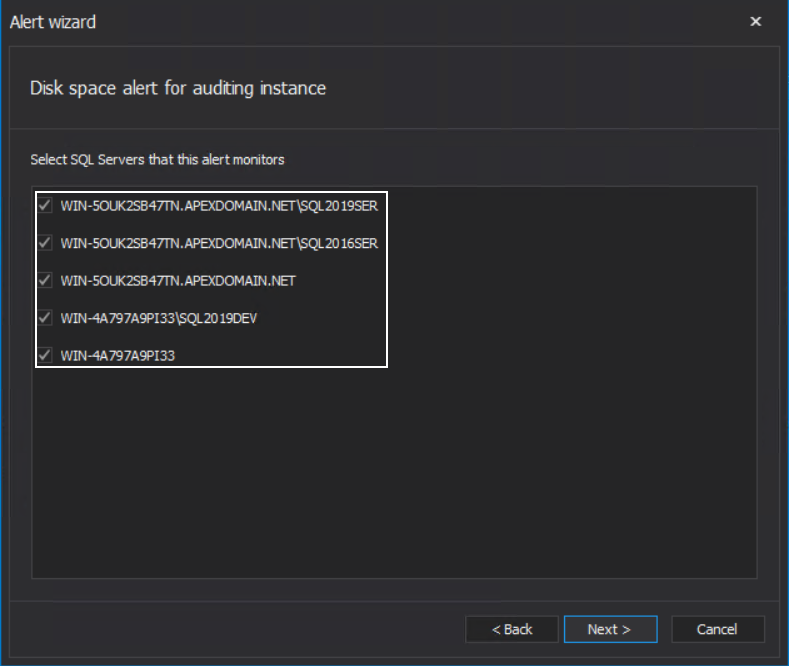
Those files include both unprocessed, raw data session files, and processed data package files. If the storage drive, where temporary files are located, was filled with data, it can interrupt further auditing as there will no longer be enough space to process audited data. First of the configuration steps specific for this alert type is the page with the audited SQL Server instance for which the monitoring should apply to:
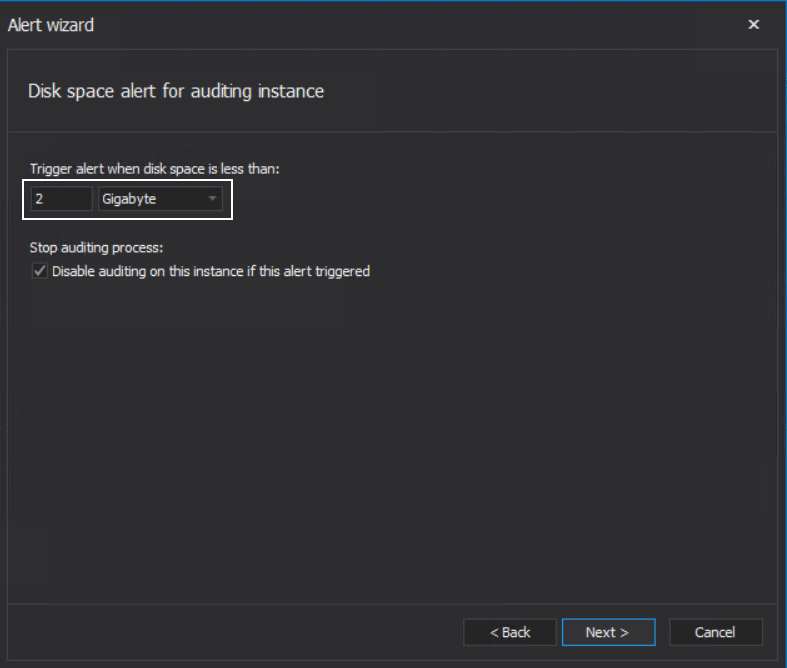
The alert has the option to set the disk size threshold limit before triggering and has the option to stop auditing at that moment:
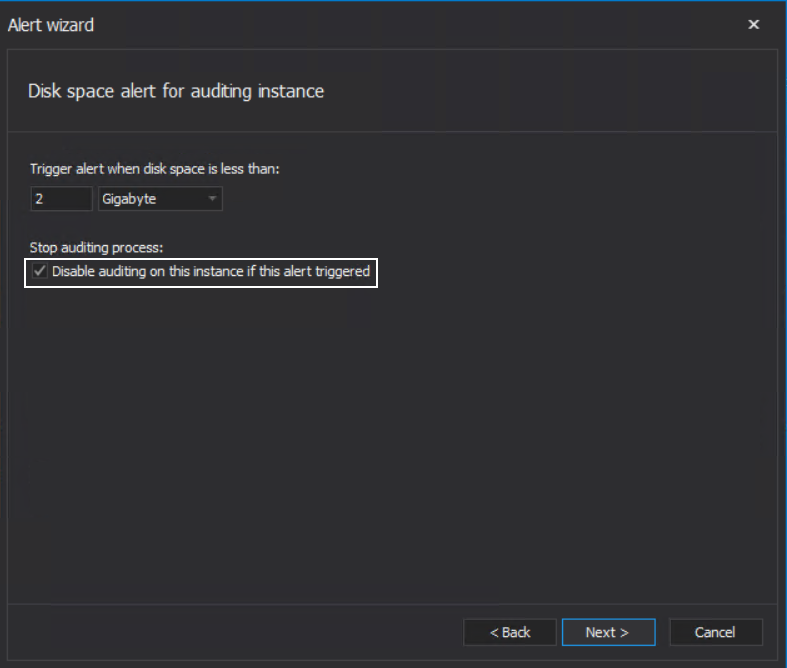
The Disable auditing on this instance if this alert triggered option will prevent “suffocating” the drive with additional temporary files and filling up the audited SQL Server session buffer with event trails that cannot be audited until the storage space issue is resolved:
Disk space alert for central repository host
Analog to previous, this alert type activates if a low storage space event occurs on the disk drive where the central repository database is located:
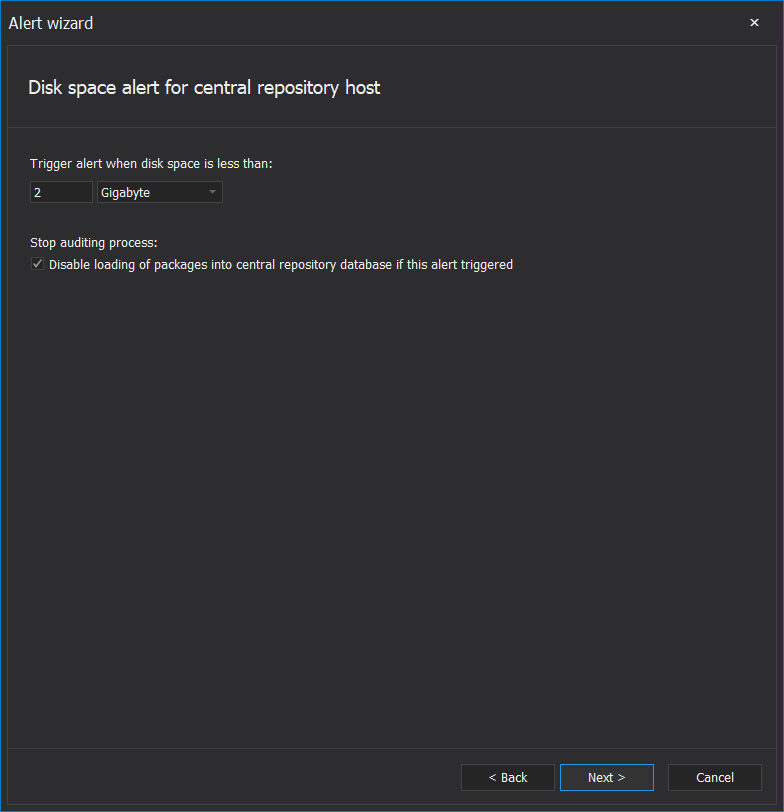
Besides setting the storage size threshold for the alert trigger, it is possible to use the Disable loading of packages into central repository database if this alert is triggered option to prevent the loading of processed data packages into the repository until the issue is resolved. This will conserve auditing data in the audited server temporary storage and prevent loss due to the inability to load data into the repository.
Both disk space type alerts will provide information about the drive letter and available space left on that drive.
Auditing filter change monitor
This is a simple alert that provides notification if the auditing configuration against a chosen SQL Server has been changed. The configuration wizard allows selection of SQL Server to be monitored from the list of audited ones:
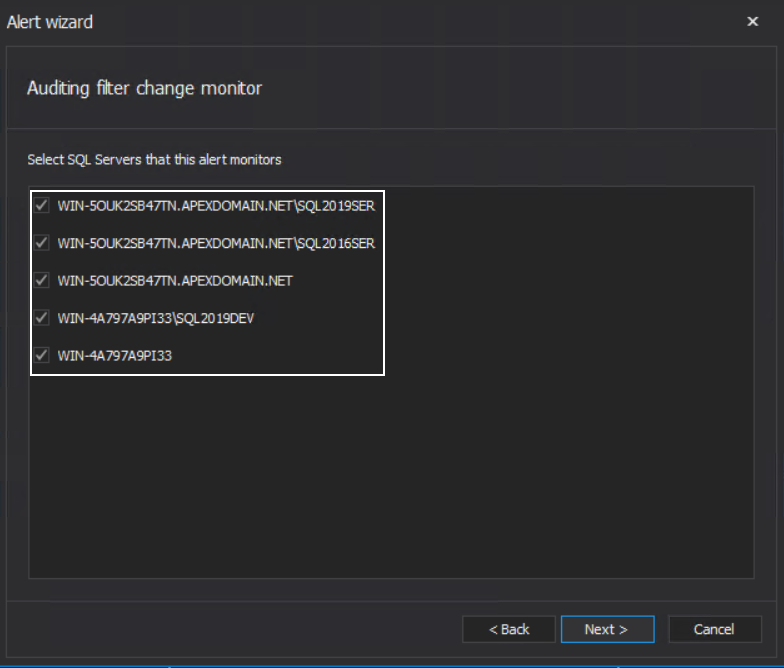
This alert can be utilized to detect if an unauthorized configuration change is applied, which user applied the change, and what was the change:
Automatic database auditing monitor
Since ApexSQL Audit has the option to automatically add newly created databases for auditing, there is the system alert that provides notification on such an event. The configuration wizard step, specific for this alert type, has the option to select a SQL Server from the list of audited servers to be monitored for automatic database auditing events:
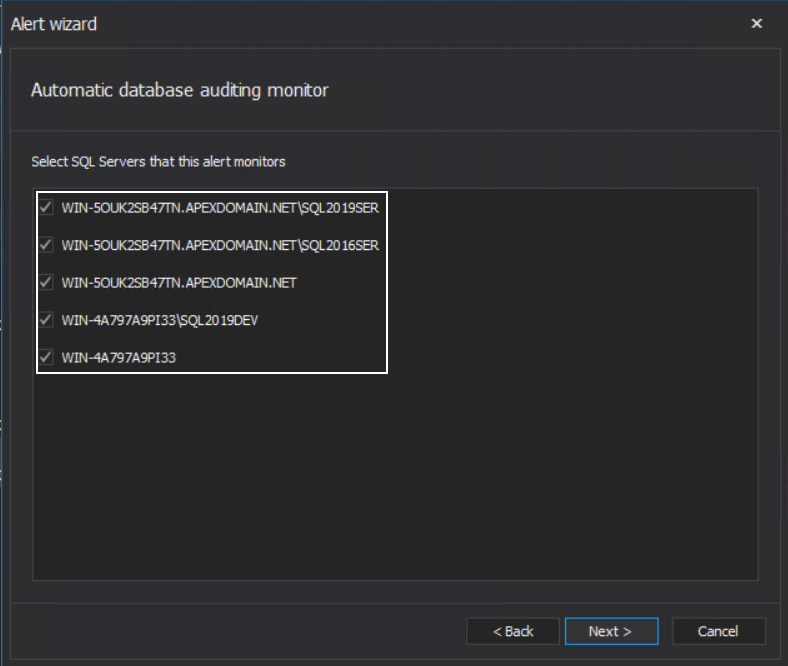
The alert can provide information on which SQL Server instance experienced the event and the name of the database added for SQL audit.
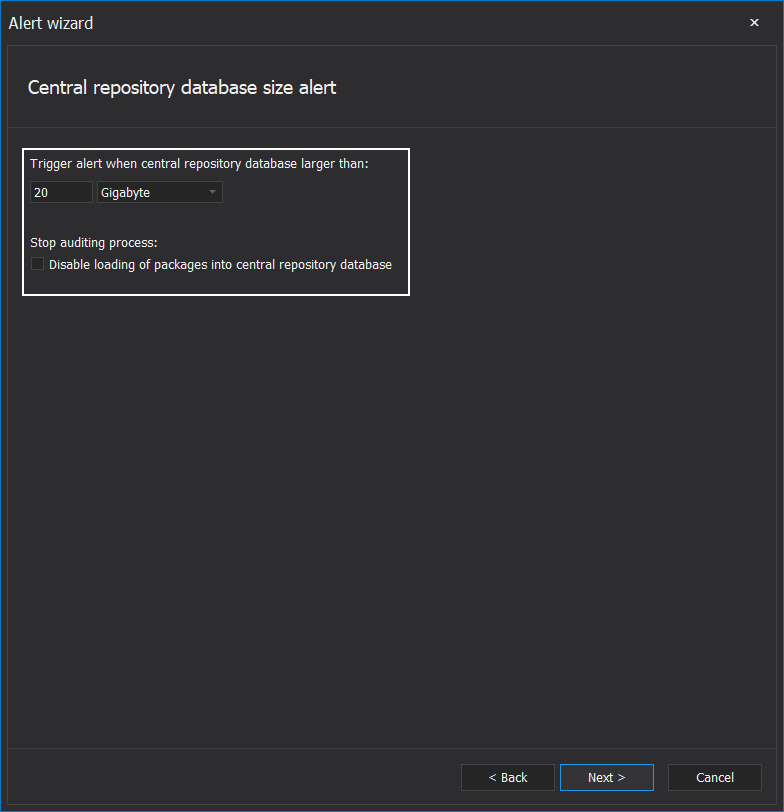
Central repository database size alert
Central repository database size is an important aspect of the SQL audit mechanism. An overinflated central repository database can be part of a bigger storage space issue, negatively influence reporting performance, or be the indicator of a large influx of audited data is being received. This is where this kind of alert can become helpful.
The alert’s configuration contains two steps. The first step allows setting the central repository database size limit before the alert gets triggered. It is possible to use the Disable loading of packages into central repository database option, which will keep data packages in queue until the database size limit is resolved. The option is disabled by default as there are no immediate negative consequences in data load continuation except for further database size increase:
The second step is to set the start time and interval to check the repository database size. The interval should not be too short (e.g., 1 second) as it will overload the host SQL Server with frequent queries, and should not be too long (e.g., 10 days) as it might skip critical moment where reaction would be needed:
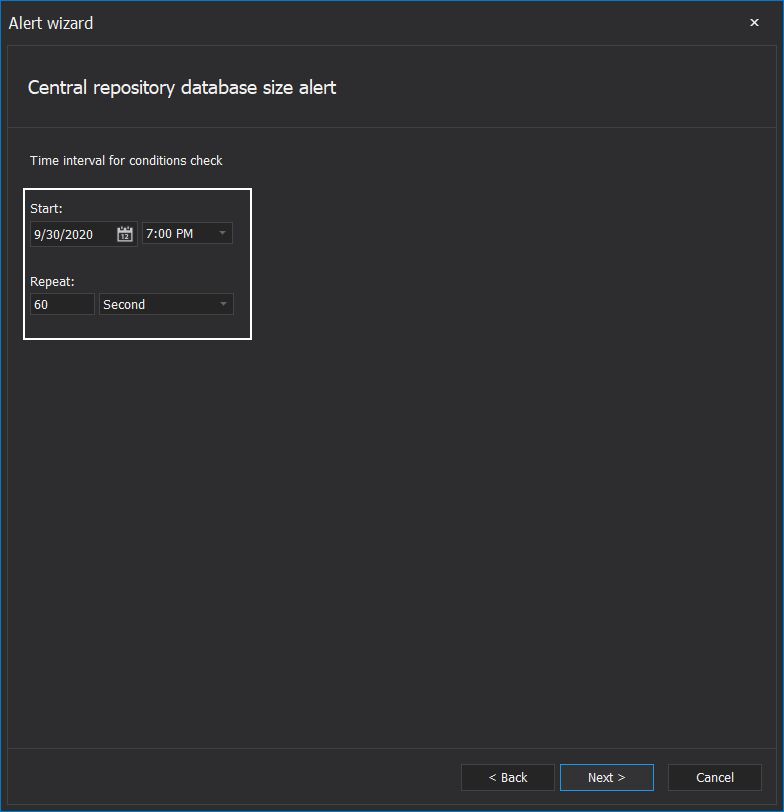
Useful information that can be relayed through the automated message can include current and maximum database size.
This alert can be resolved by manual archiving explained in the Archiving the Central repository database – ApexSQL Audit article, or scheduled archiving, explained in the following article: Schedule archiving in ApexSQL Audit
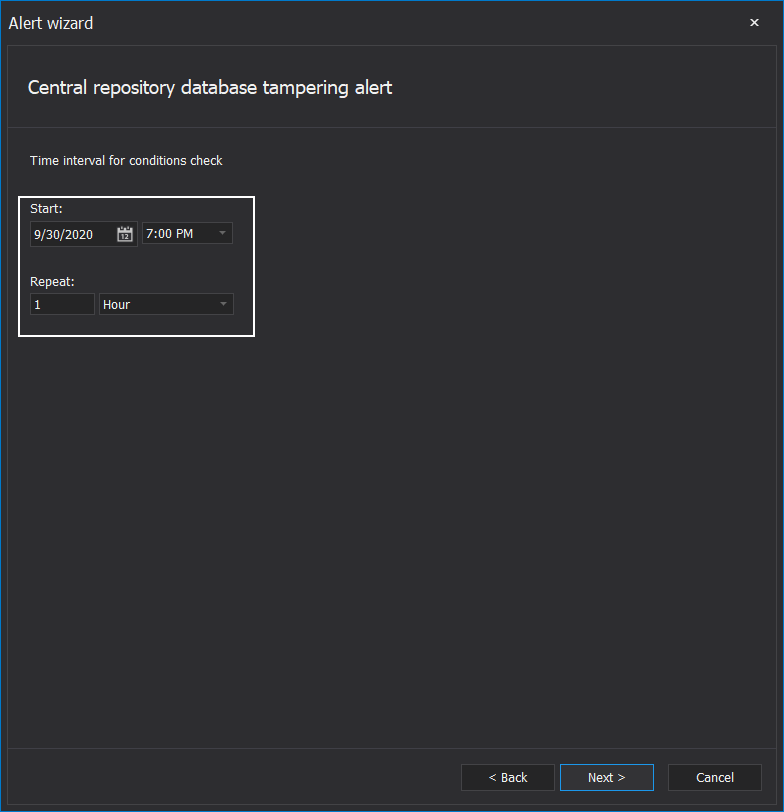
Central repository database tampering alert
The alert’s function is to warn if central repository database integrity has been compromised. This can be the consequence of tampering around the repository database, for example, a deletion attempt of stored events. The configuration step specific for this alert allows us to set the checkup interval. The interval should not be too short as the integrity checks can be performance-intensive:
To verify the alert notification and manually check the integrity of the central repository database, follow instructions from the article: Verifying SQL audited data integrity of central repository database
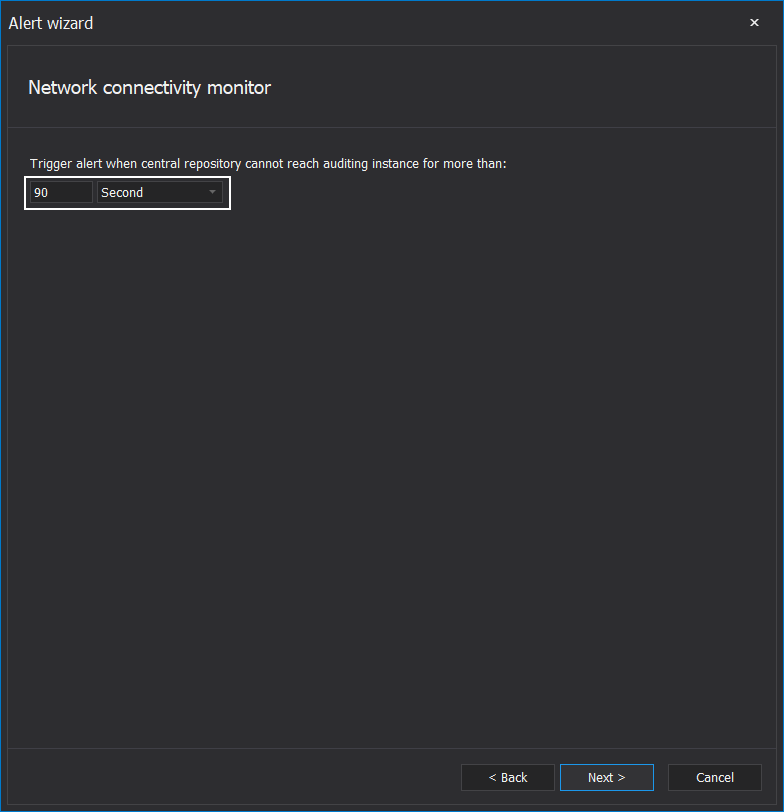
Network connectivity monitor
Since SQL audit mechanisms depend on the stable network connection between the central instance and audited SQL Servers, it would be recommended to utilize this alert. The central instance service will check for a response from remote audited instances and register if there has been silence in communication. The alert configuration allows us to set how much time without communication is needed before triggering the alert:
And what is the interval between responsiveness checks? This interval should be lower than the communication breakdown interval:
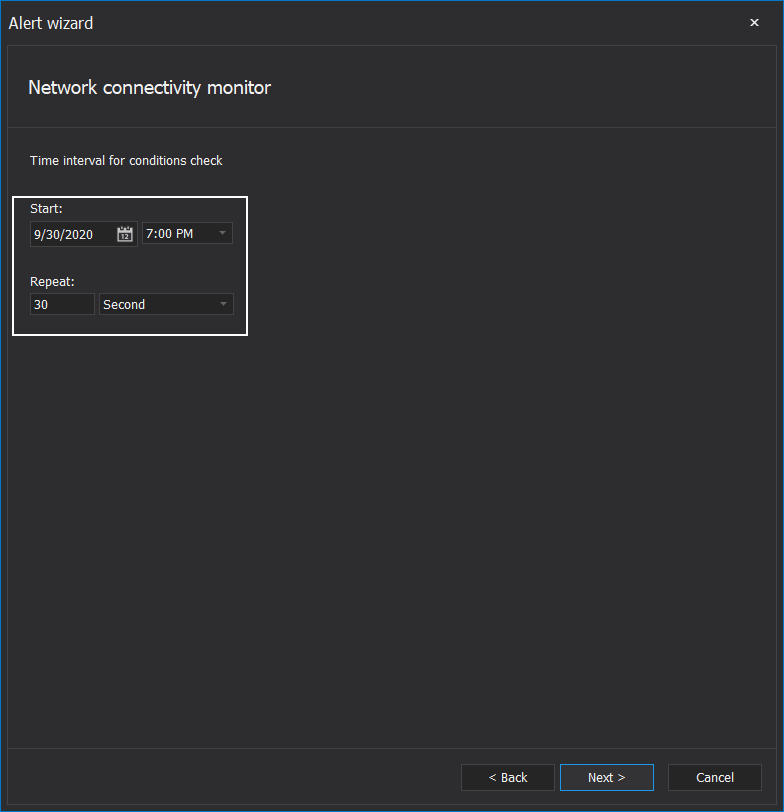
The message with this alert can provide names of instances that have lost and/or regained connection.
SQL Server connectivity monitor
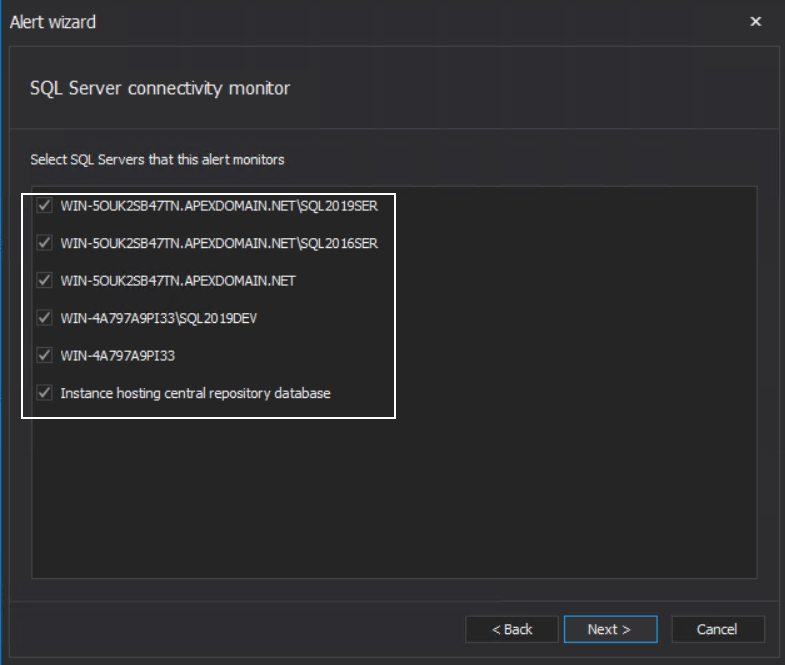
This system alert checks if the connection to an audited SQL Server can be established and is active. This can indicate a different scope of problems from the network connectivity. Such problems include situations like SQL Server is removed, or in some kind of maintenance state, or extremely high data traffic and machine resource consumed, so accepting communication from the central instance is impossible. There are three configuration steps for this alert. The first step is to select SQL Servers from the list of ones where SQL auditing is applied, central instance hosting repository is included:
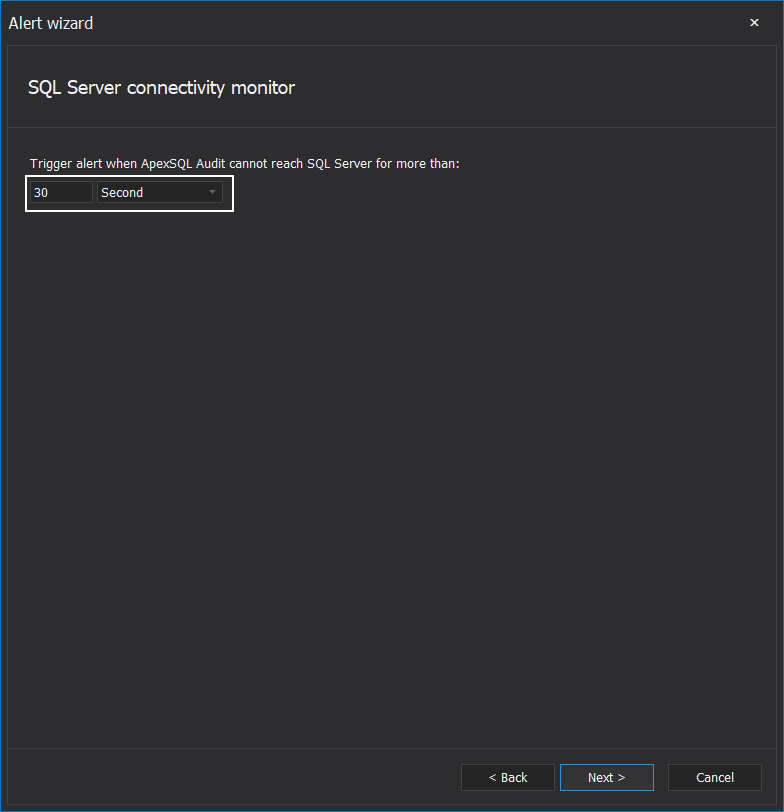
The following step sets the time limit before the alert is triggered when a SQL Server is unavailable:
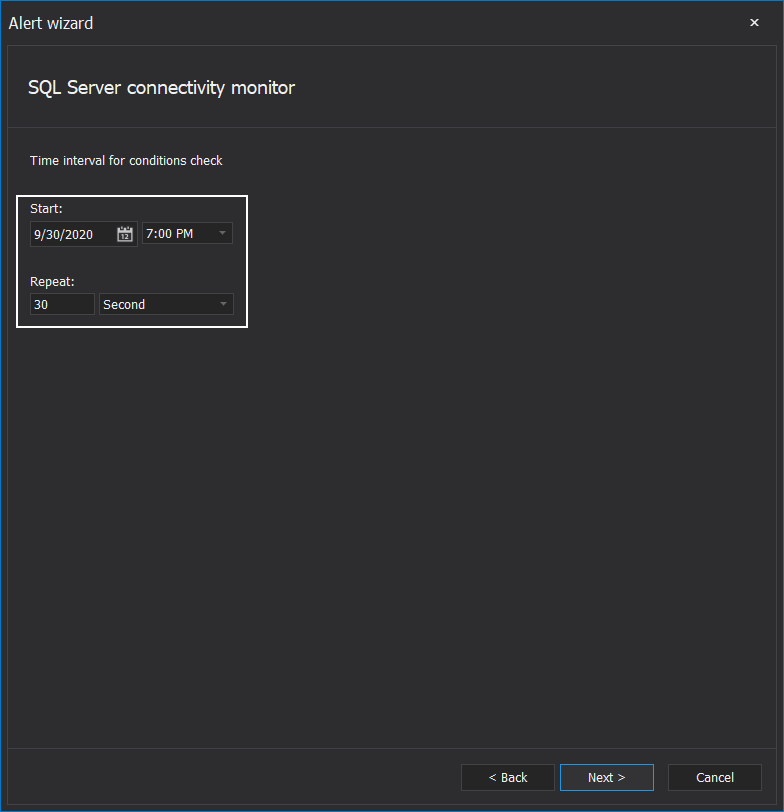
The third step sets the start time and intervals between SQL Server availability checks:
The alert message will show which SQL Servers are unavailable and what was the period set for inactivity before notification.
A combination of these system alerts, if triggered simultaneously, can help better pinpoint the problem and resolve it to continue uninterrupted SQL audits.


