


Applies to
ApexSQL Monitor
Description
Timely, queries will be collected and added automatically for monitoring. Within the Query waits view, users can review query execution time and other information like total wait time, execution count etc.
|
Quick tip: To make sure that only queries from specific databases are being collected, narrow to a desired set of databases for monitoring. |
In this article, we will show how to manage queries, simply by excluding and/or including specific query or queries, with some additional options, that can facilitate the review of potential query wait issues.
FAQs
Q: How to exclude a particular query or queries from monitoring?
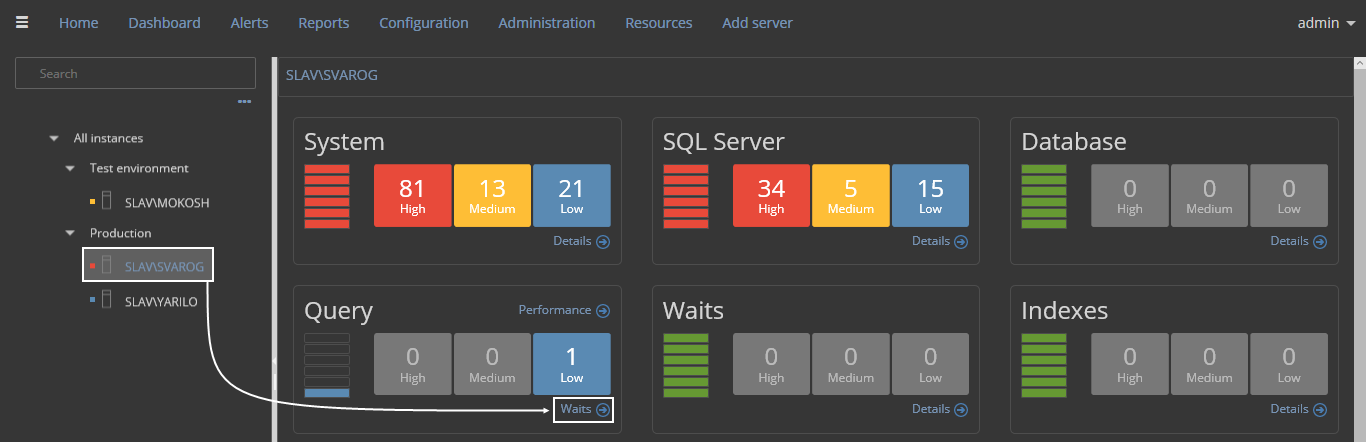
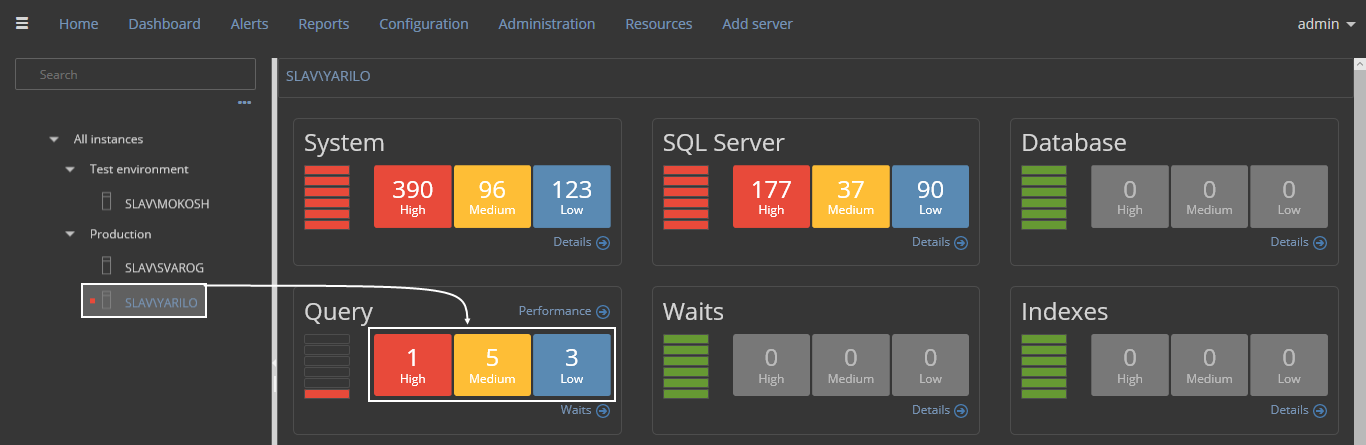
A: To exclude a particular query or a desired set of queries, choose a desired SQL Server instance in the Tree view, click the Dashboard subsystem link and then on the Waits link under the Query alert panel:
Scroll down to the grid, and review the desired query:
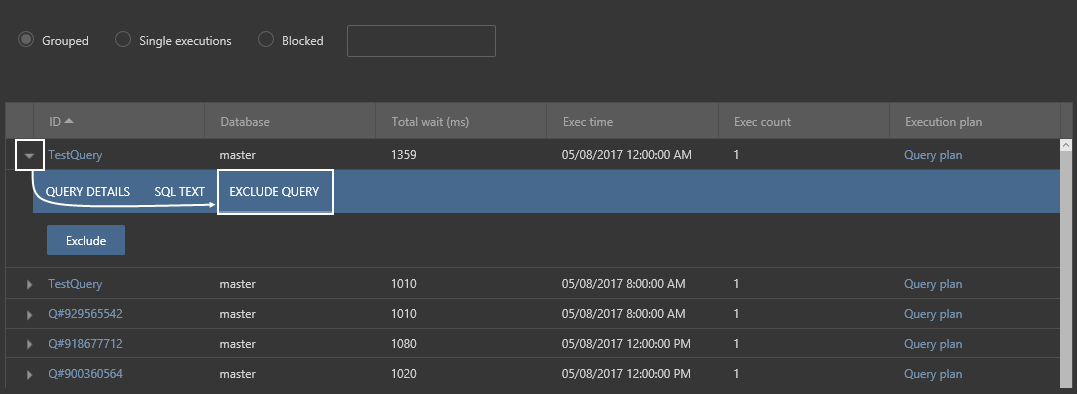
Click on Exclude query link and click on exclude button to opt out a specific query. In this example, we will exclude the custom named query (TestQuery).
Q: How can I rename a specific query or grouped queries?
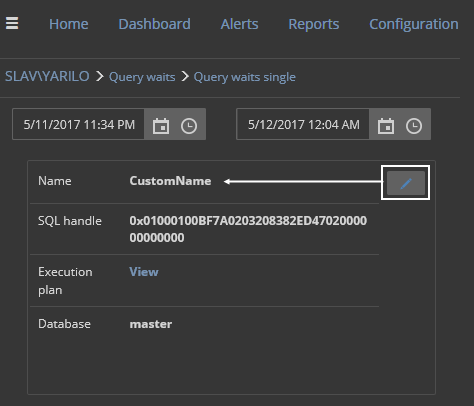
A: In the Query waits view, click on a desired query ID (marked below):
Click on the Edit icon in the Name field, input a desired query name, and save the changes:
|
Quick tip: Renaming a grouped query (the same query with different execution and wait times) will cause all the members of the group to use a given name. |
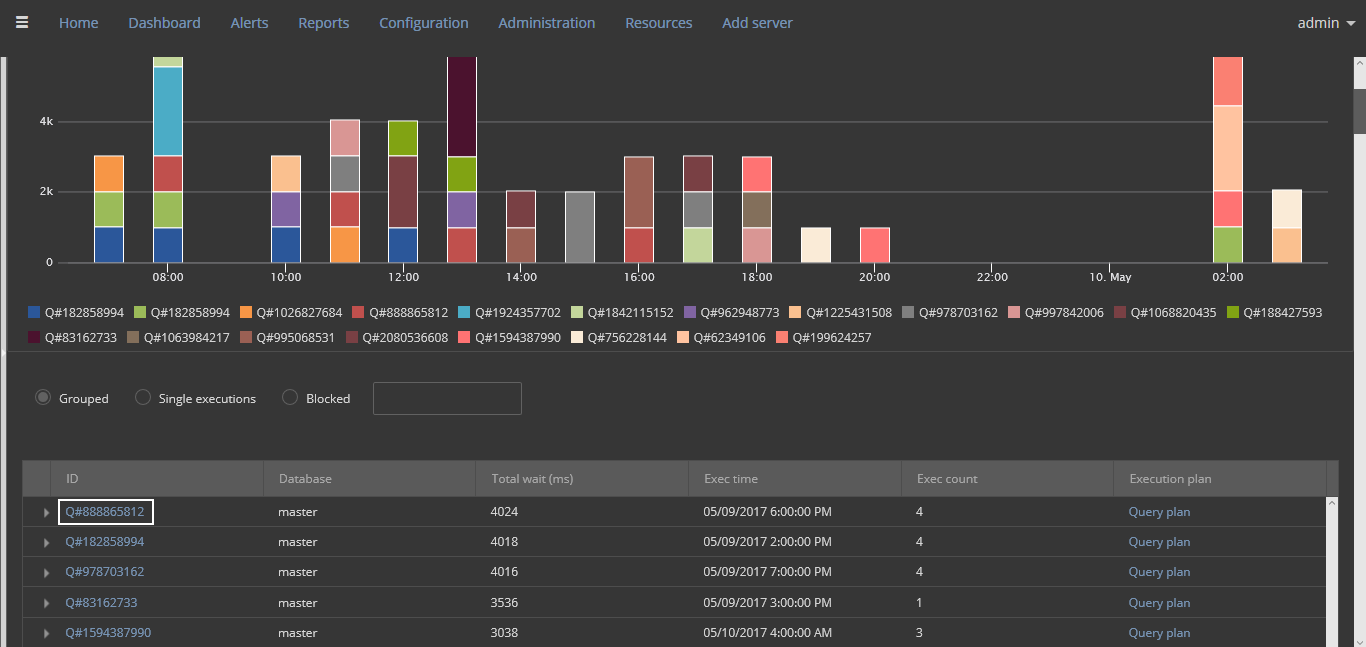
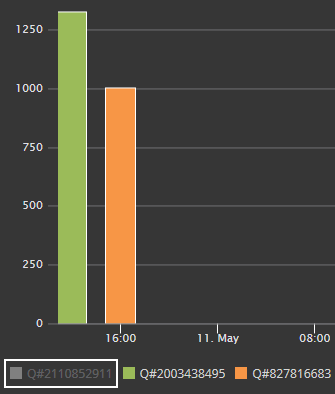
Q: If I uncheck a particular query from the query waits chart’s legend, will it be excluded from monitoring?
A: No, it will not. Only the bar for that query will not be visible in the chart (marked below).
Q: How can I include a query that I previously opt-out of?
Go to the Configuration subsystem and choose Queries tab:
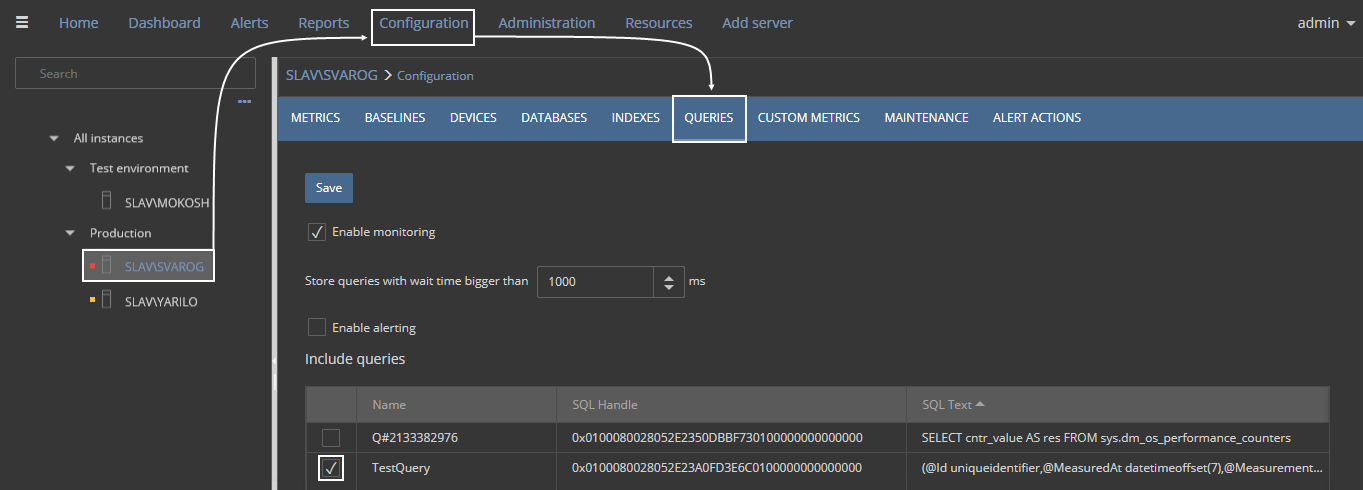
All of the queries that were previously excluded from monitoring, will appear in the grid, shown above.
To include the query (TestQuery) back, tick the checkbox next to it and save the configuration.
Q: How can I customize the query monitoring and query alerting parameters?
A: There are several parameters which can be set to the specific SQL Server instance configuration within ApexSQL Monitor. These can be set by clicking on a Configuration link and navigation to query tab, as shown in the picture below:
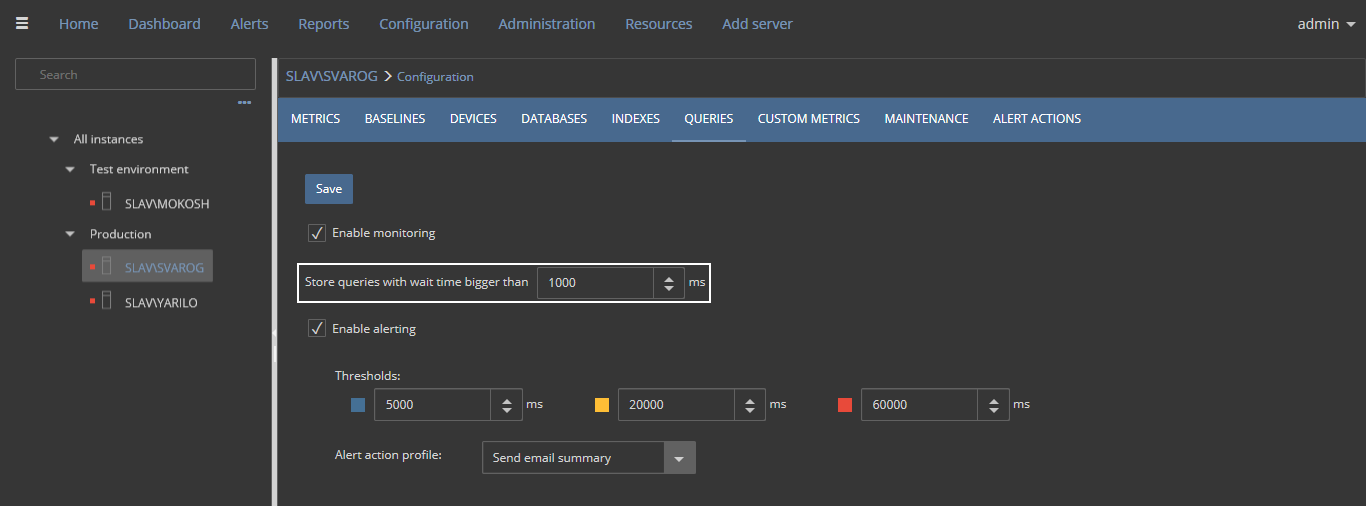
Every query with a wait time longer than 1000 ms (a default value) will appear in the Query waits view.
Also, every query with a wait time longer than any threshold will appear in the Query wait statistics alerts view.
Optionally, an alert action profile can be embedded, and executed whenever an alert related to query wait is raised.
Q: How can I review and resolve alerts related to a specific query?
A: Since these queries cannot be excluded from Query waits view, their corresponding alerts should be reviewed and resolved.
You can either go to the Group Dashboard (All instances), and click on the alert notification icon in the Query column,
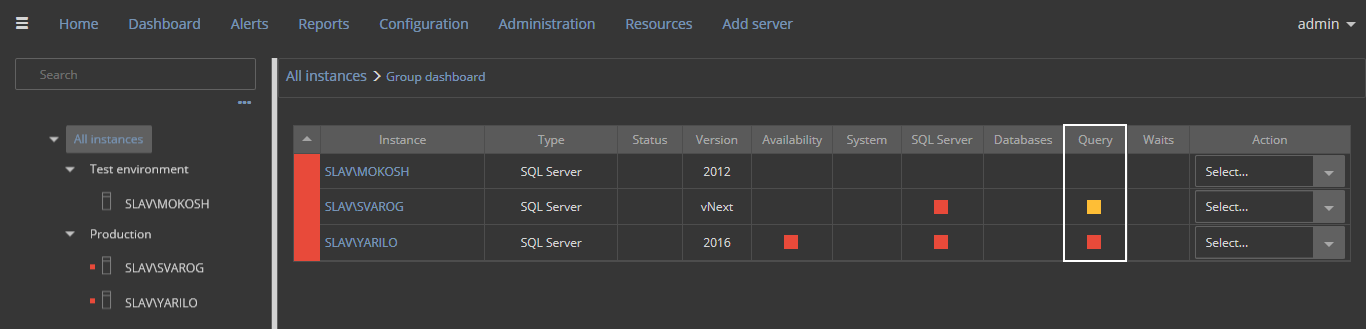
or click on the alert notification panel in Server Dashboard:
The Query wait statistics alerts page will display:
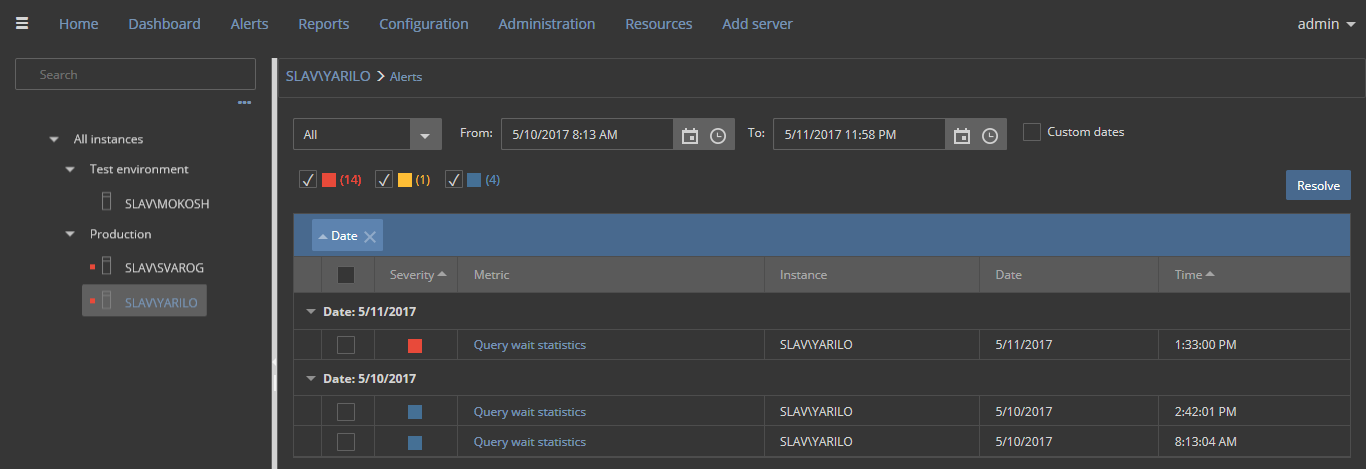
For a detailed review, select any alert from the list and resolve it individually.
See more


