A development of a database implies constant code checks for inconsistencies. Using ApexSQL Enforce, a tool that contains over 100 pre-installed rules, code checks will consume less time. It can detect and fix all inconsistencies. Existing rules are editable and you can create new ones as well. Additionally, the whole code reviewing process can be automated.
This article covers every step of the code reviewing process, from the setup of a rulebase to reading of the the results.
Setting up a rulebase
For the purpose of this article we will use pre-installed ApexSQL rulebase, which will be installed with the application, and stored on the C:\Users\<current_user>\Documents\ApexSQL\ApexSQL Enforce\Rulebases location.
Since ApexSQL Enforce can be used as a stand-alone application or as SQL Server Management Studio and Visual Studio add-in, we will show the main differences between using it in all three forms.
The code review process through stand-alone application
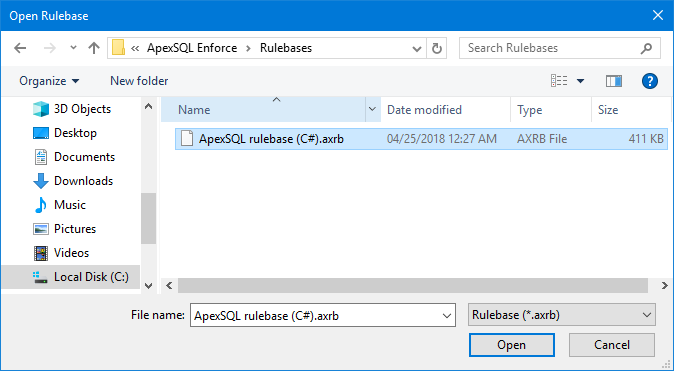
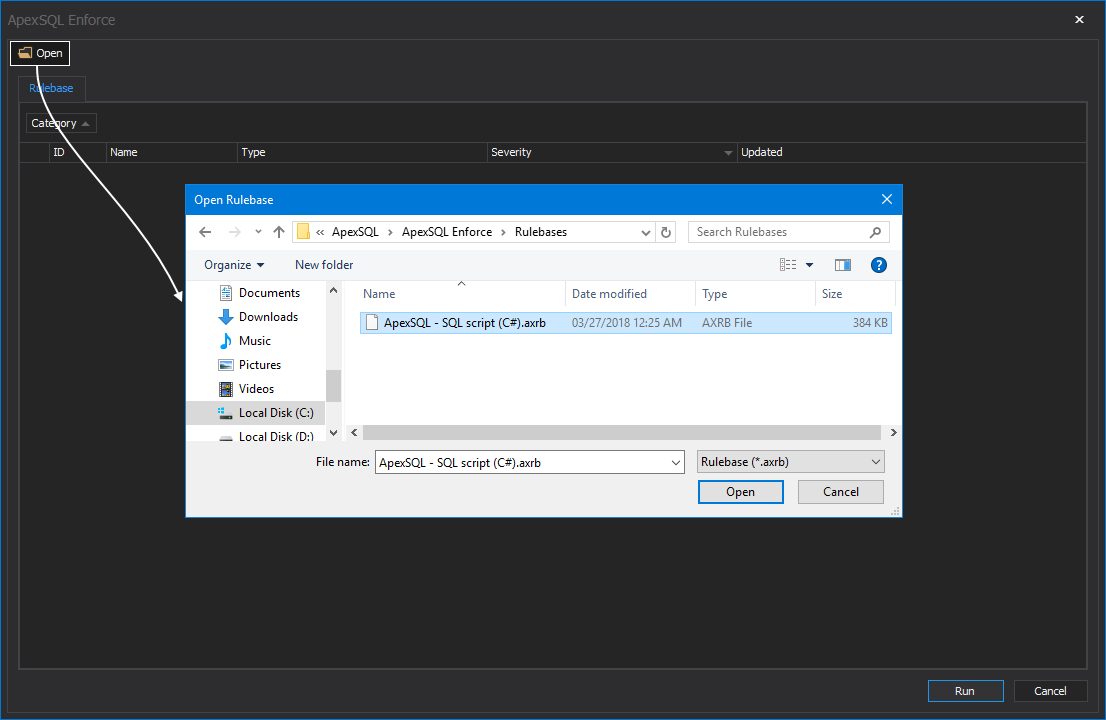
Through the ApexSQL Enforce stand-alone application, you can create your own rulebase or use the pre-defined one. Since we already decided to use the pre-defined ApexSQL rulebase, click the Open button in the Rulebase part of the Home tab. This action will open the Open rulebase window, where you can choose the rulebase. We will choose the ApexSQL rulebase and click the Open button.
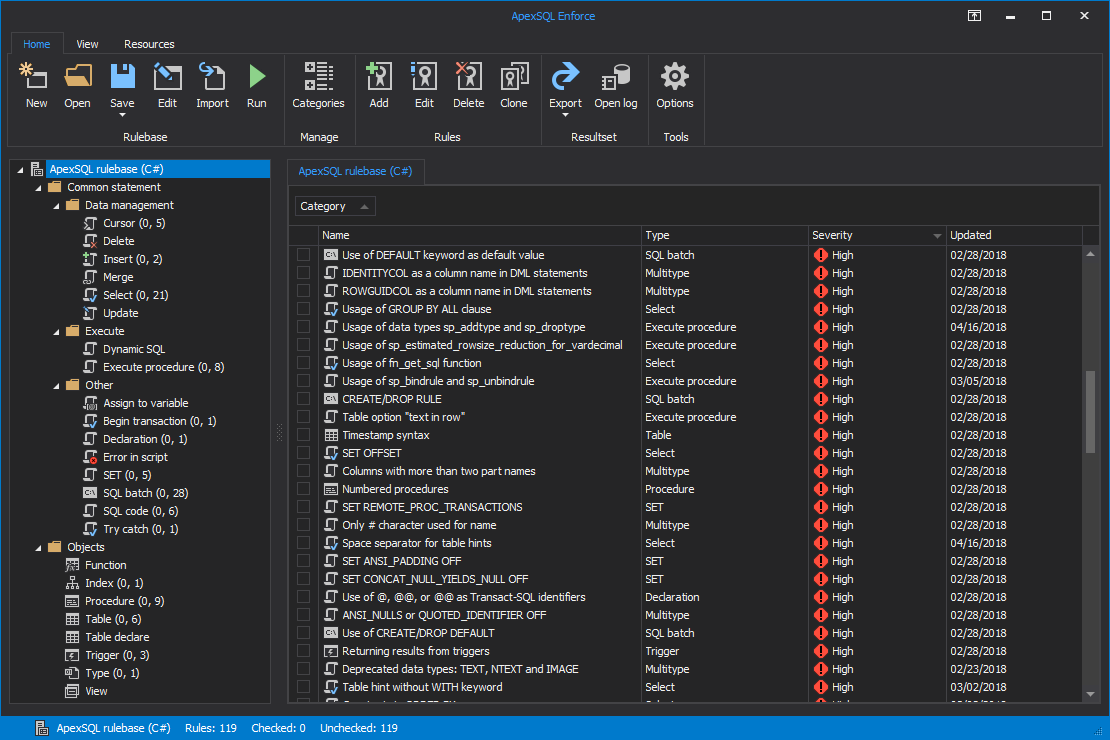
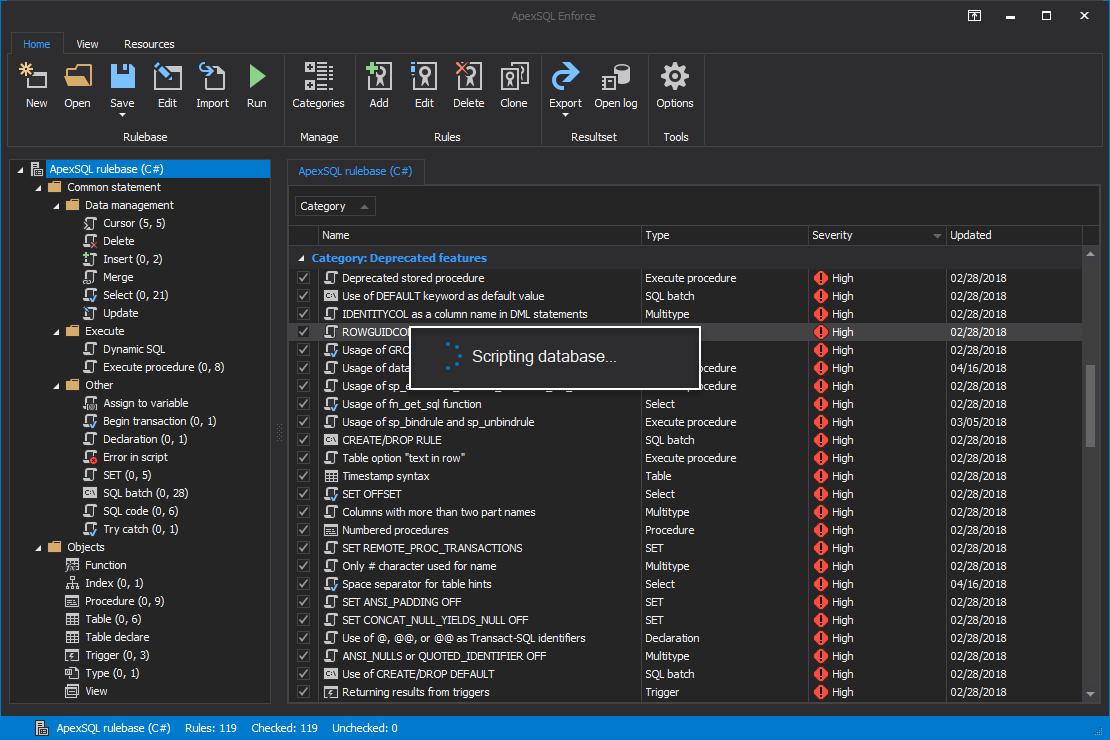
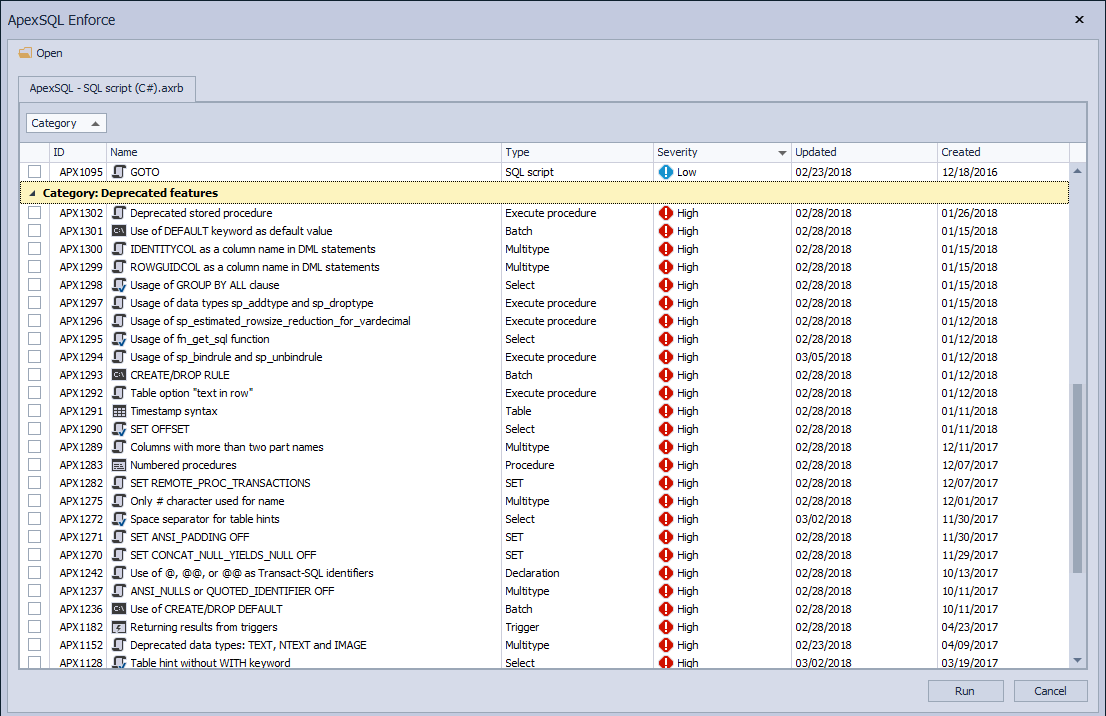
When the rulebase is opened, on the left part of the main ApexSQL Enforce window you will have the rulebase tree, where all rules will be grouped by objects against which they can be applied. Next to the rules group name is present number of all rules from that group.
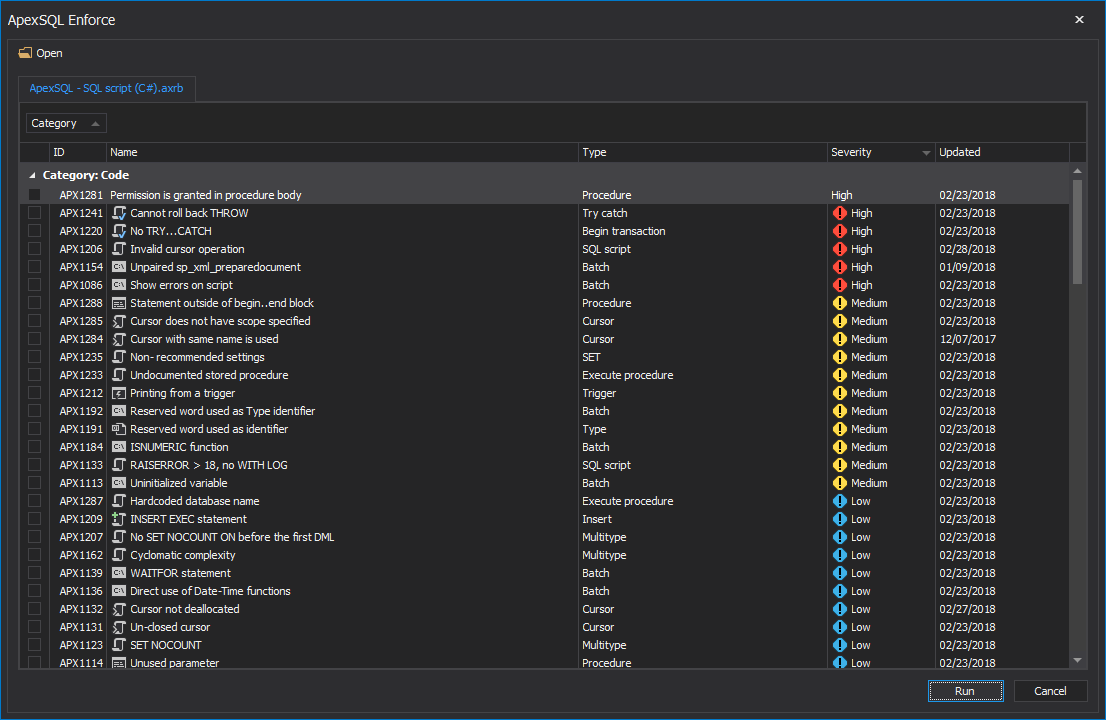
On the right side of the main window, all rules will be listed, grouped by depending categories (Naming convention, Deprecated features…).
Checking which rules will be run against a database can be done in two ways, either from the tree view or from the rulebase grid.
Note: Selecting the rules group name in the rulebase tree will list all rules from that group in the rulebase grid.
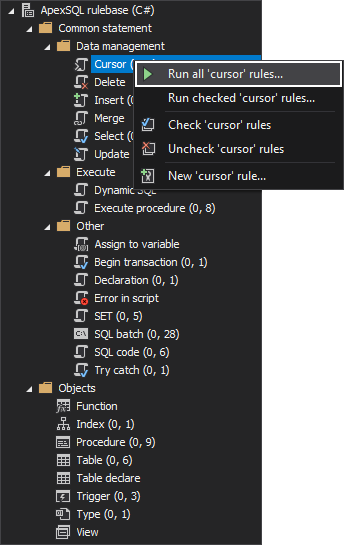
To check all rules from one group you can either right click on the rules group name in the rulebase tree and from the context menu click the Check ‘name of the rules group’ rules command:
Or, right click in the rulebase grid and from the context menu click the Check all command:
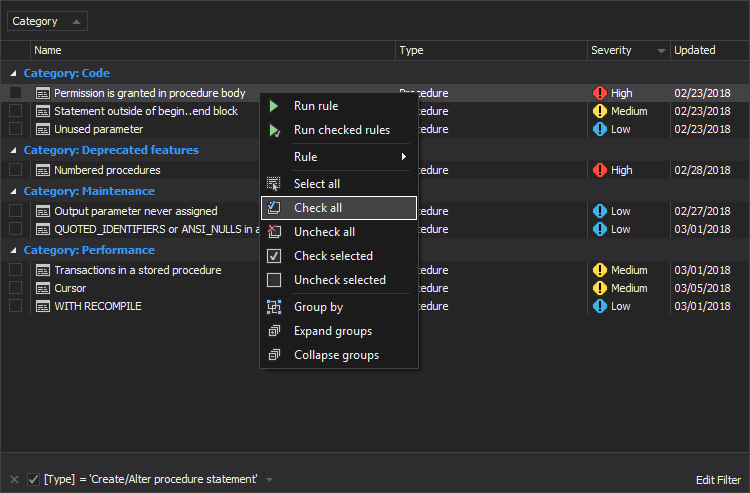
Either way you choose, after you check the rules, the number of checked rules from the selected group will be shown by its name in the rulebase tree:
Checking rules one by one can be done only from the rulebase grid. In the rulebase tree, select rules group or the whole rulebase, and from the rulebase grid check rules which you want to run against a database.
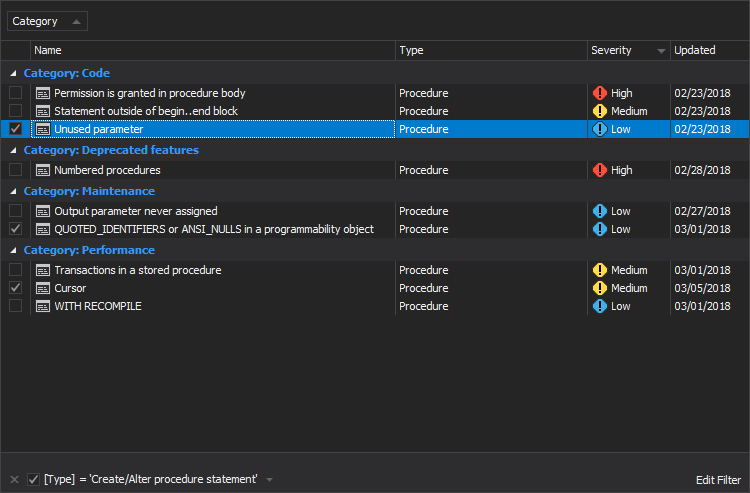
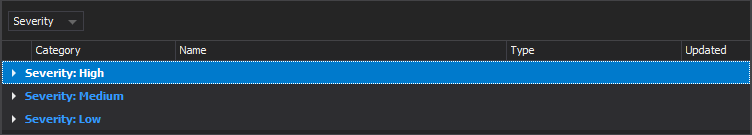
We want to run all rules with High severity. In the rulebase tree we will select the whole rulebase and in the rulebase grid we will group all rules by severity (click on the Severity column’s header, drag it and drop it to group panel), so we can check them easier:
Expand the High group, select the first listed rule, press the shift keyboard key, scroll to the end of the high severity rules and select the last listed rule.
Note: All actions which can be done in the rulebase grid are explained in the Customizing rulebase and resultset grids for grouping, filtering, sorting, searching and displaying article
Right click on the selected rules and from the context menu choose the Check selected command:
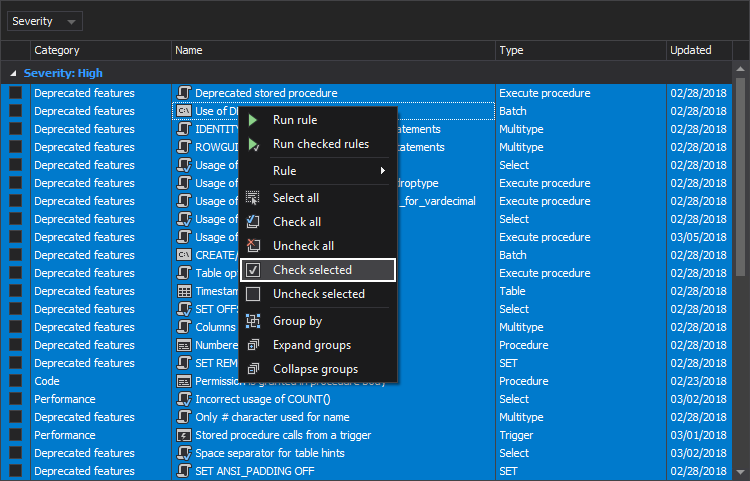
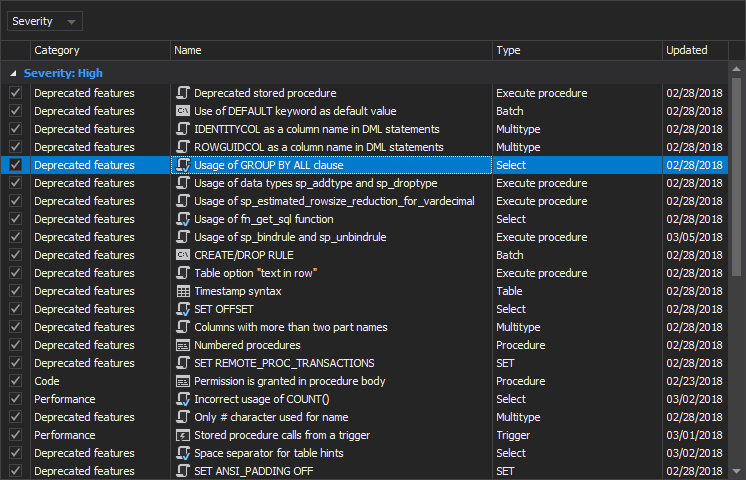
This way we checked only the high severity rules to run against a database.
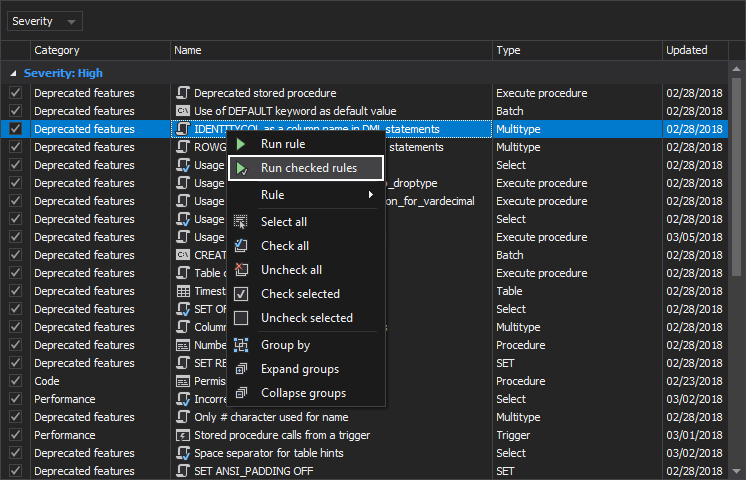
To run checked rules against a database, right click on the checked rules in the rulebase grid and from the context menu choose the Run checked rules command:
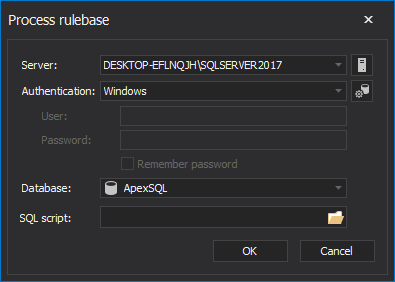
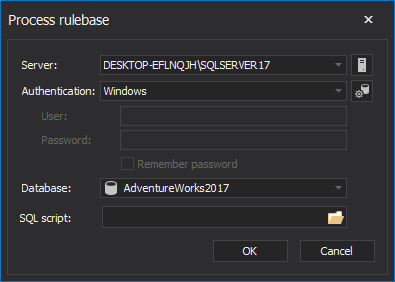
This action will open the Process rulebase window:
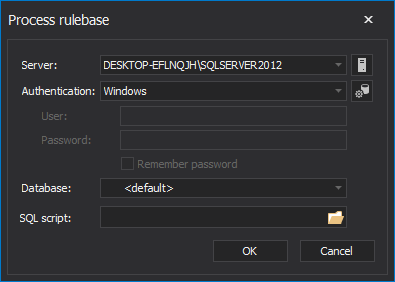
In this window, choose a SQL Server, type of authentication and a database or SQL script to run checked rules against it. We will choose the SQL Server 2017, the windows authentication and the Adventure Works 2017 database:
When the OK button is clicked on, the selected database first will be scripted and then the rules will run against it:
When the whole process is done the Result summary window will be open:
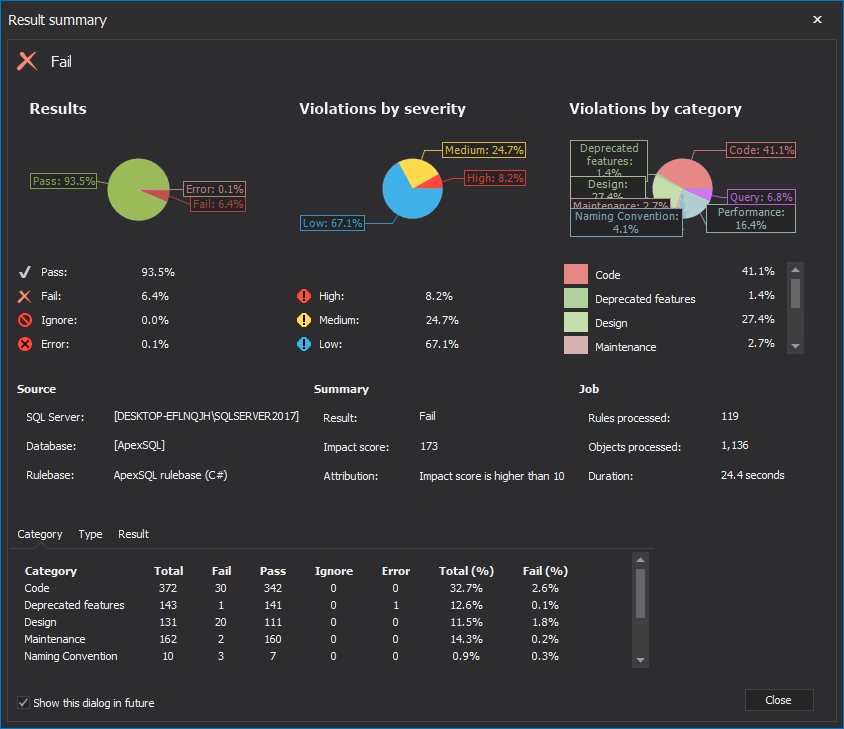
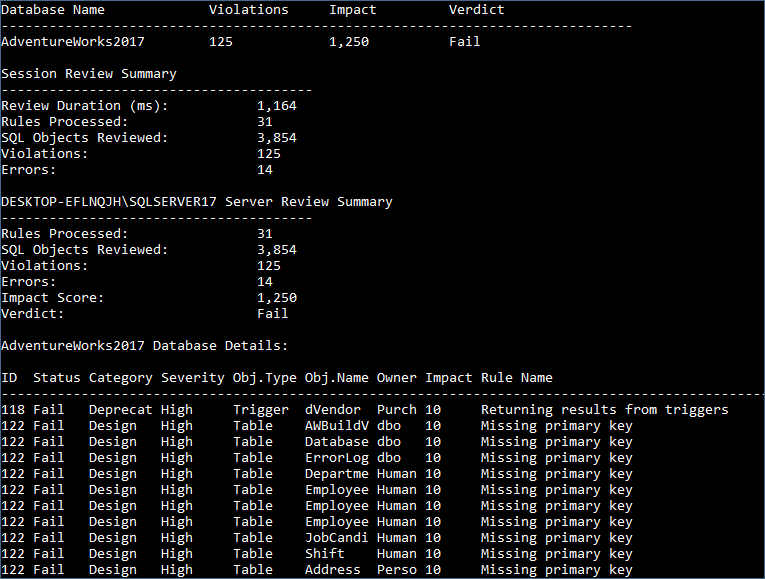
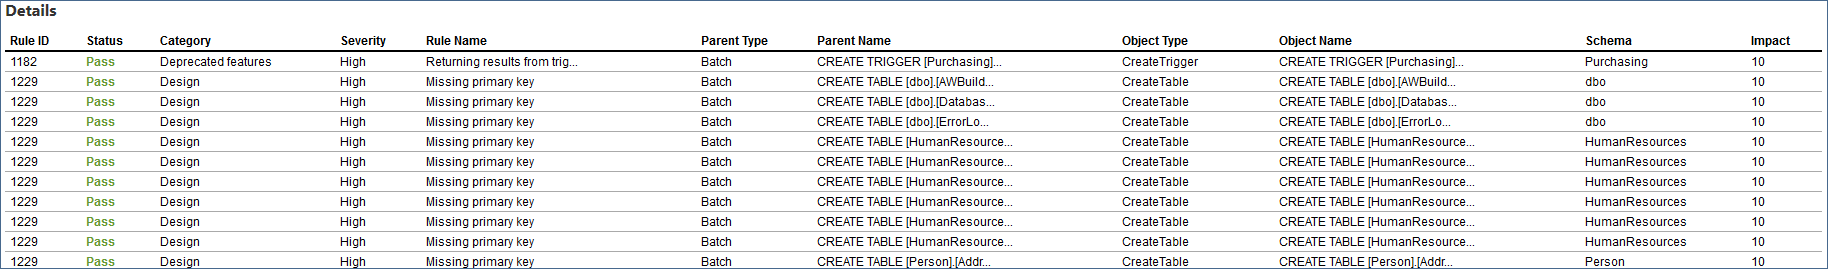
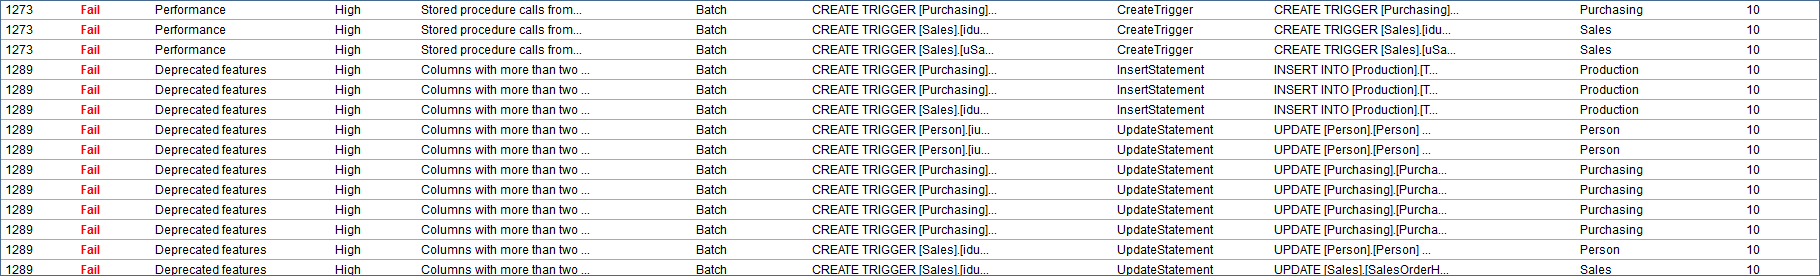
In this window all necessary information about ran rules and their success is listed. Beside the basic information (on which SQL Server and which database was reviewed, how many rules were checked, how many database objects were reviewed, general result…), here are listed, in number and percent, how many of the ran rules have passed, failed, ignored or return some kind of error, sorted by the result category or by result type.
Note: The information is shown both numerically and graphically.
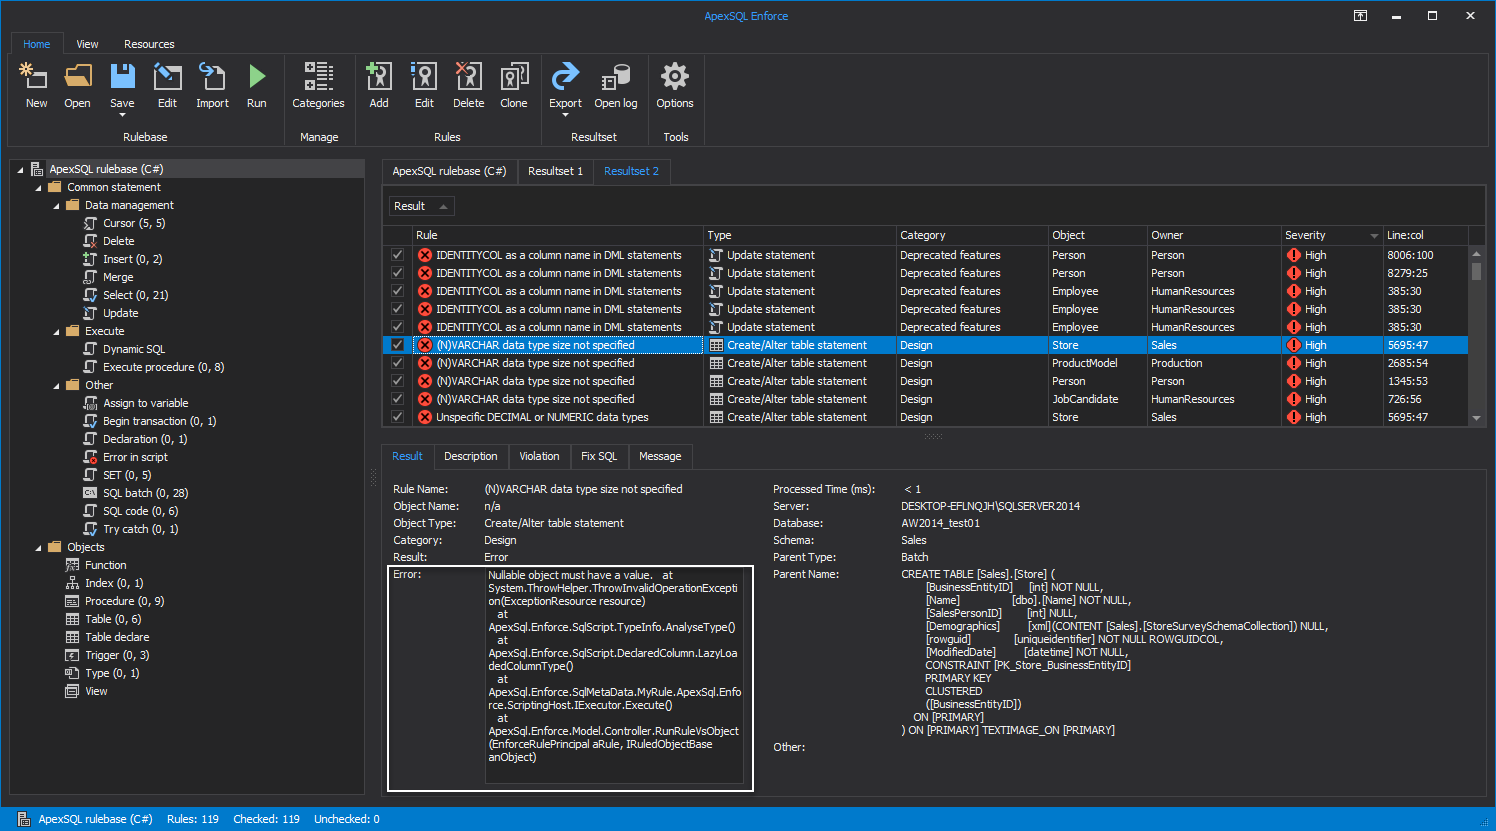
Detailed information about which rule failed/passed or return error on which database object, will be present in the Resultset grid, after the Result summary window is closed. To check why the ran rule resulted in an error, select it in the Resulset grid and under the Result tab the error description will be present:
Creating an HTML report
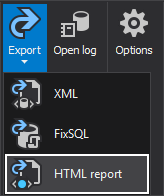
The results can be exported and saved for further analyses. Click the Export button and from the dropdown list choose the HTML report command:
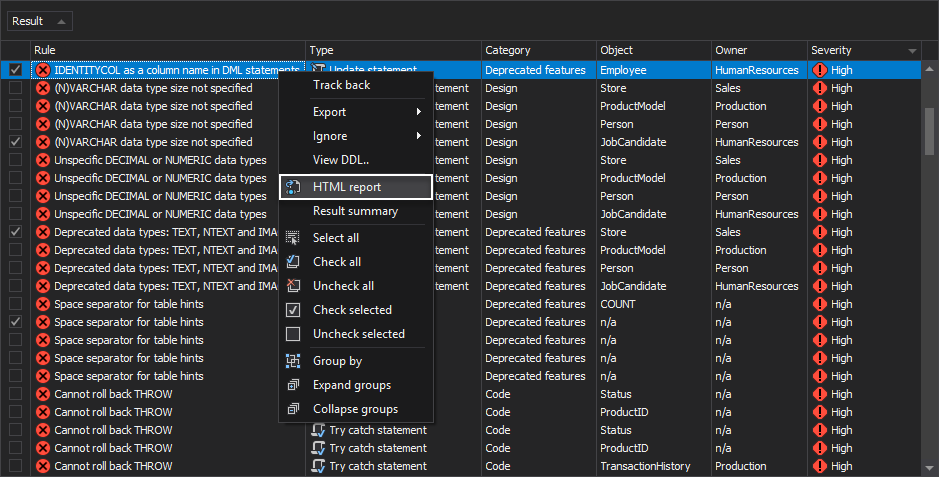
Or right click in the resultset grid and from the context menu click the HTML report command:
This action will open the HTML report window, where you can set how information from the result summary will be present:

If the All option is checked, under the Filter by result group, than all rules will be present in the HTML report (passed, failed, ignored or with error return).
If the Checked only options from the same group is checked, only the selected rules from the resultset grid will be shown in the HTML report.
Depending on which sub-group is checked (pass, fail, ignore, error) from the Filter by selection group, only that type of the results will be shown in the HTML report.
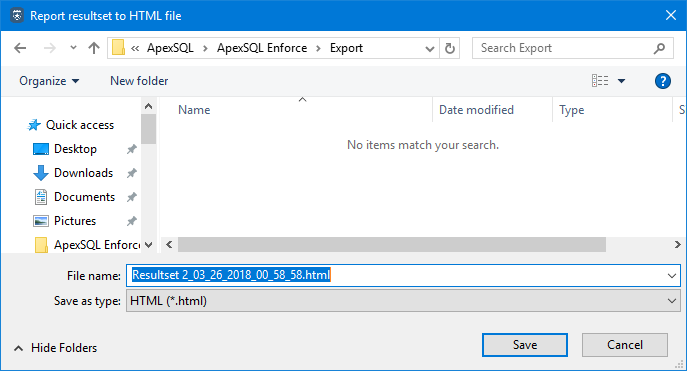
When all the options are set, click the Create button and save the HTML report:
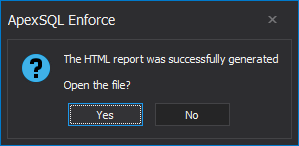
After saving is done you will be asked to open the saved HTML report in a web browser:

Running rules from SQL Server Management Studio/Visual Studio
The main difference between running the rules against a database from the stand-alone application and from SQL Server Management Studio (or Visual Studio) is in the action order. In the stand-alone application first step is choosing the rules and then choosing a database (or script) to run against. In the add-in, a database is chosen first and then the rules to run against it.
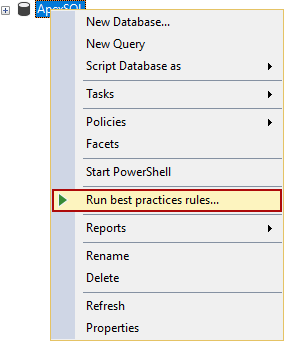
Let’s open SSMS17 and connect to the same SQL Server (SQL Server 2017). In the Object Explorer pane right click on the same database (Adventure Works 2017), and from the context menu click the Run rules command:
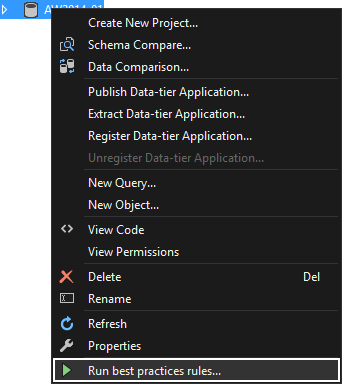
The same option in Visual Studio:
After the ApexSQL Enforce window opens, click the Open button and choose the ApexSQL rulebase:

The same window in Visual Studio:
The same window in Visual Studio:
Note: In the add-in versions, the rulebase tree view is not present
The rest of the running rules against a database process is the same as in the stand-alone application, which has already been explained.
How to automate the reviewing code process
The whole reviewing code process can be automated.
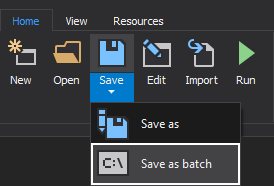
After rules are checked (as we have already explained), in the rulebase grid, click the Save dropdown list and click the Save as batch command:
This will open the Process rulebase window, so you can choose SQL Server and a database against which will rules be ran:
After all is set, click the OK button and the Save as batch file window will be open:
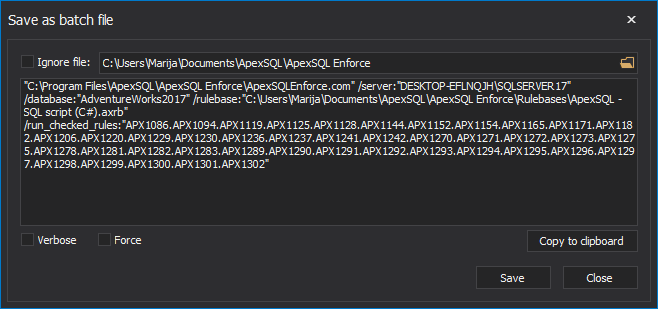
In this window the batch file can be edited by adding the additional switches like \Verbose or \Force or you can include the ignore file /ignore_file”C:\Users\Marija\Documents\ApexSQL\ApexSQL Enforce”
Editing the batch file can be done in this window. To add any of the additional switches (/ignore_file”C:\Users\Marija\Documents\ApexSQL\ApexSQL Enforce”; \Verbose; \Force) just check it and they will be added automatically in the batch file.
Note: In the Save as batch file window the checked rules list can be edited by adding or removing the rule ID from the list
When the batch file is set, click the Save button and choose the location where the file will be saved. To run this script, double-click on it. After the process is done, the result summary will be shown similar like from the GUI application: