


Applies to
ApexSQL Monitor
Summary
This article explains how to configure SNMP service for localhost, and set up the SNMP trap in ApexSQL Monitor, as a part of the alert actions in system, SQL Server and database performance monitoring.
Description
Used as a protocol for monitoring the network resources and networking devices, Simple Network Management Protocol (or SNMP) is the communication protocol that collects information from IP-enabled devices or systems in collaboration with SNMP agent, which can be Windows-based or a third-party software.
The collected and processed information based on specific alert or event rules are SNMP traps, which can be sent, received and analyzed. Also, the important element of SNMP is the SNMP management software (or trap destination), by which user can determine what exactly happened when SNMP trap is sent.
ApexSQL Monitor supports SNMPv1 and SNMPv2 traps. To send the SNMP trap from ApexSQL Monitor, the prerequisites include an installed SNMP service (Windows feature), and a SNMP manager (SNMP trap destination) by choice that will receive those SNMP trap(s).
-
How to configure SNMP service to use it on the local machine?
The SNMP is usually included as the active Windows feature. Check its presence in the Control Panel, under Turn Windows features on or off option in Programs tab. If it is not checked, install it on the machine where the ApexSQL Monitor service is running, because alerting information are included in central repository database.
After installing and (optionally) restarting the machine, configure the SNMP service to receive SNMP traps from any source, through Services management console, and make sure it is running.
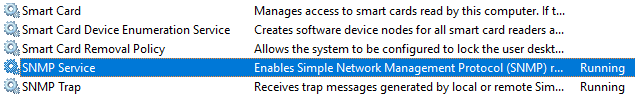
Open the Properties of the SNMP Service:
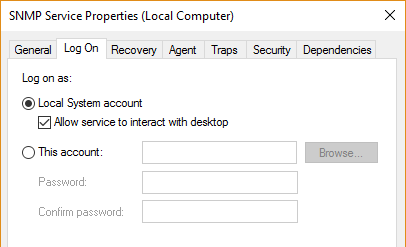
In Log On tab, check the Local System Account option.

Quick tip:
If credentials for specified user account are in use, provide corresponding permissions for that user utilizing ApexSQL Monitor.
After that, go to the Agent tab, and check the Service options like in picture below:
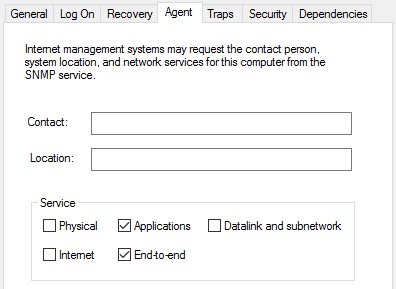
The Applications, and especially End-to-end options are the most important to check, because the Applications option allows sending the SNMP traps from the software solutions as ApexSQL Monitor is, in collaboration with SNMP service, and End-to-end option sets the local machine to act like an IP host and listener (localhost), which will be used in setting the SNMP trap in ApexSQL Monitor’s Send SNMP trap feature.
Select the Traps tab and input the default community name string, public (it is case-sensitive), and then click on the Add to list button:
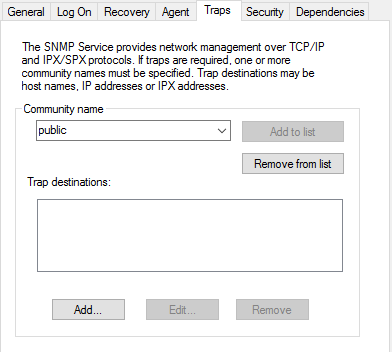
If the Add to list button remains disabled, the string is added. When input, a community name string identifies the IP host, and validates the SNMP trap request from its source (in this case, that will be ApexSQL Monitor).
Quick tip:
Use the public community string for non-restricted usage of localhost as an IP host through SNMP service.
In the Security tab, select the option Accept SNMP packets from any host:
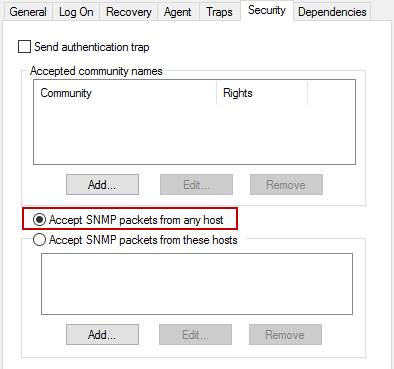
Alternatively, a single host or hosts can be added to the list of trusted hosts.
-
How to set and send SNMP trap from ApexSQL Monitor?
The SNMP trap sending feature in ApexSQL Monitor is a part of alert actions, along with two preset alert action profiles for determining deadlocks in SQL server performance.
With sending SNMP traps functionality, ApexSQL Monitor sends an alert action to the users that are not connected on the Internet, and are not capable of receiving alert actions via email. Also, this feature fully integrates with ApexSQL Monitor as an SNMP trap sender, into one unified monitoring system.
Quick tip:
The SNMP trap sending is related to alert triggering event, if there is no alert activity, no SNMP trap will be sent.
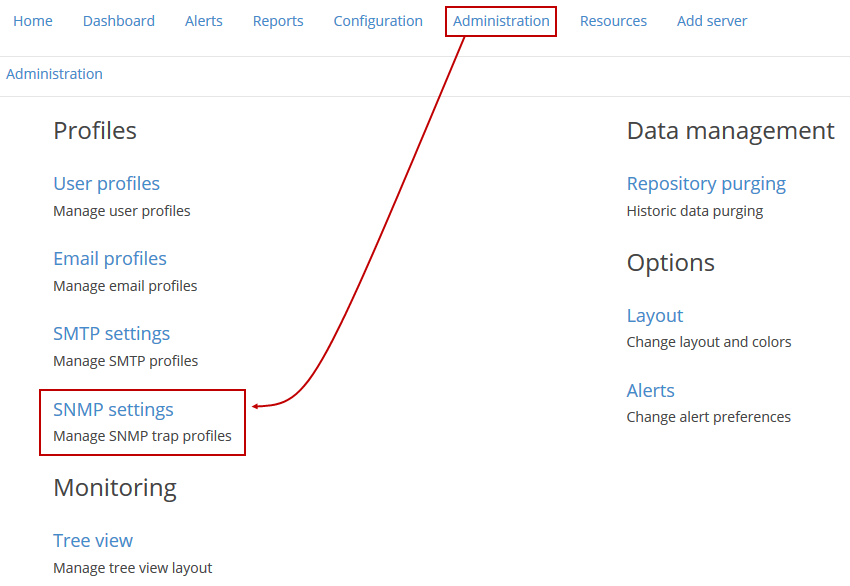
To set the alert action profile for sending the SNMP trap whenever some of the selected alert triggers, create a new SNMP profile within SNMP settings option, in Administration subsystem, as shown in picture below:
Input data in corresponding fields. In this article, a localhost will be the SNMP provider, so input necessary information like in picture below, and save the provider configuration.
The name of the provider is just a name of the profile, and an IP address identify the host:
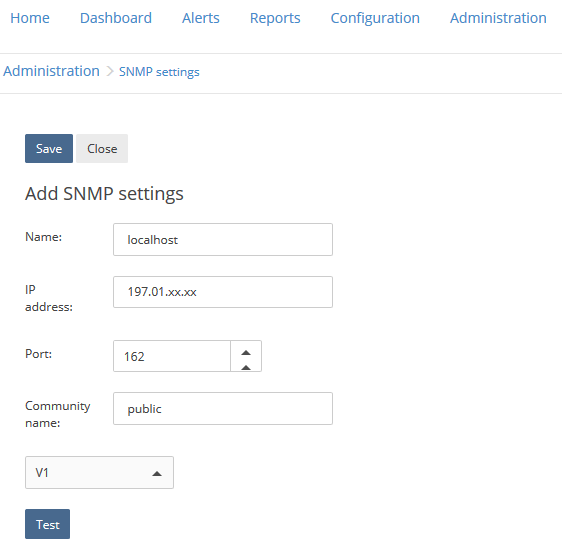
Notice that the number of the port is already set, because SNMP uses UDP port 162 for SNMP trap messages. Also, community name string is set to public, by default, and the version of SNMP traps can be changed between V1 and V2.
Testing the SNMP trap
When all is set, press Test button, and the success message should appear:
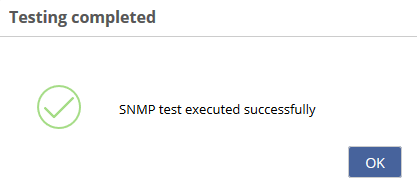
Testing the SNMP profile also sends the initial SNMP trap to a SNMP manager, identifying the local machine name.
After saving the SNMP profile configuration and testing the execution of the alert action, the “localhost” SNMP profile (or in other words, provider) can be used within custom alert action profile.
|
Important notice: In this article, the SNMP provider is the localhost. To send SNMP traps through remote machine, obtain its valid IP address, and acquire necessary permissions in order to use ApexSQL Monitor remotely. |
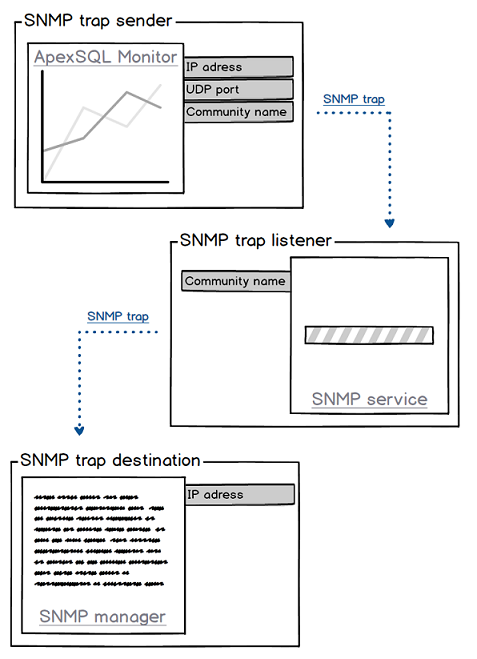
Visual interpretation of SNMP trap sending process in ApexSQL Monitor
FAQs
Q: How to determine the IP address for the localhost?
A: Although the default address for the localhost is 127.0.0.1, the IP(v4) address of the localhost provider can be obtained with this PowerShell script below, and result will appear below the last line of the code:
$IP = get - WmiObject Win32_NetworkAdapterConfiguration |
WHERE {$_.Ipaddress.length - gt 1 } $IP.ipaddress [0]
Q: How do I determine the IP address of a remote machine?
A: The first requirement is that the access to the remote machine is permitted. In that case, use this PowerShell script to obtain the IP address:
Test - Connection $COMPUTERNAME - count 1 | SELECT @{Name = "Computername";Expression = {$_.Address}},Ipv4Address
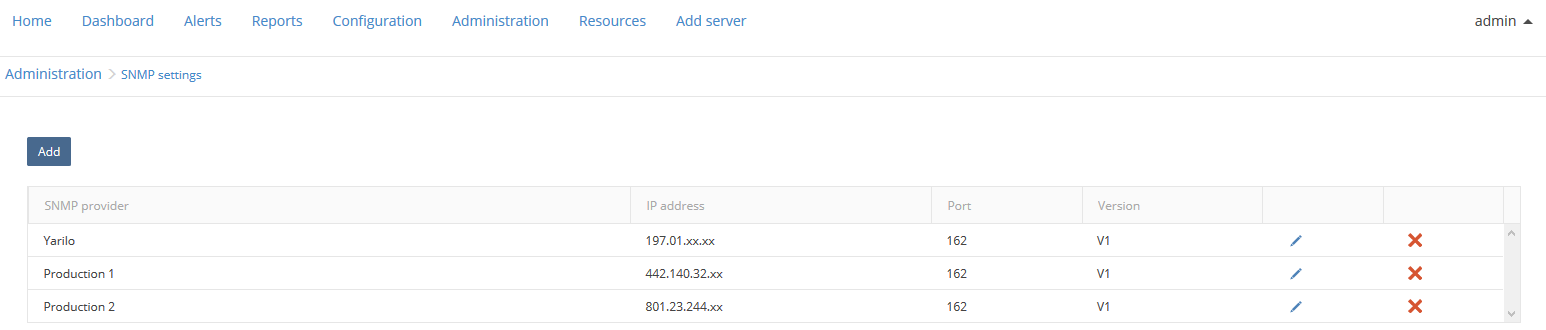
Q: Can the alert (or set of alerts) be sent within multiple SNMP traps at once?
A: Yes, it/they can. Create a set of SNMP profiles, configured separately for names and IP addresses:
After creating and saving the SNMP profiles, select a desired SQL server instance in the tree-view, navigate to the Configuration subsystem, Alert actions tab, and create the custom alert action Multiple SNMP trap send:
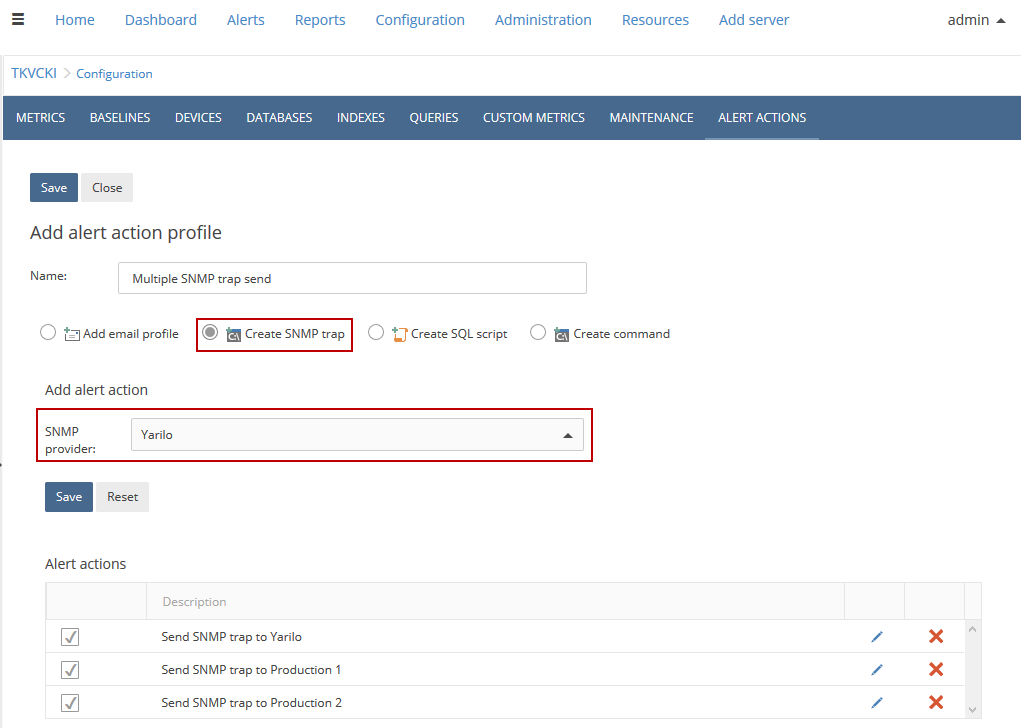
Like in the picture above, select Create SNMP trap option and include all or selected SNMP profile from the SNMP provider menu. After saving the alert action profile, SNMP providers will appear in the Alert actions grid below (as shown in the bottom of the picture above).
Q: Can I combine all of these three alert actions (Create SQL script, Create command and Create SNMP trap) to execute them all at once?
A: All of the mentioned options can be included together into single action profile, and set the specific tasks within them separately. So, yes, it is possible to execute SQL script, run batch file and send the SNMP trap at the same time when some alert triggers.
Q: I have set everything as stated, but I still don’t see any SNMP trap received?
A: The SNMP traps sends every time some alert or group of alerts trigger, which relates with more or less critical threshold value. If there is no activity, there will be no alert action that will send the SNMP trap, and it will remain inactive. Use Test functionality to force alert check, and then analyze the thread in a SNMP trap manager.
Q: How can I receive and analyze the SNMP traps sent from ApexSQL Monitor?
A: ApexSQL Monitor only sends the SNMP traps, and there is no possibility to track them or analyze them further within the application. There is a kind of software solution called SNMP manager, which can receive and show the SNMP trap in particular form of coded information: through object identifier (OID), which is the part of the MIB file.
Q: Where I can find the MIB file of ApexSQL Monitor?
A: ApexSQL Monitor’s MIB file is placed in c:/Program Files/ApexSQL Monitor/MIB.
ApexSQL Monitor MIB file definitions overview
| MonitorTrap variables | Syntax | Description | ApexSQL Monitor OID value |
| MonitorTrap (Initial trap) | – | “This is a ApexSQL Monitor TRAP message.” | 0 |
| Machine | DisplayString | “Machine that triggered the alert.” | 1 |
| Instance | DisplayString | “SQL Server instance that triggered the alert.” | 2 |
| Device | DisplayString | “Device that triggered the alert.” | 3 |
| Database | DisplayString | “Database that triggered the alert.” | 4 |
| Table | DisplayString | “Table that triggered the alert.” | 5 |
| Metric | DisplayString | “Name of the metric.” | 6 |
| MetricDescription | DisplayString | “Description of the metric.” | 7 |
| Value | DisplayString | “Measured value.” | 8 |
| TimeStamp | DisplayString | “Date and time when the alert was raised.” | 9 |
| Severity | DisplayString | “Severity of the alert.” | 10 |
| Description | DisplayString | “Description of the alert.” | 11 |
| Comments | DisplayString | “Alert related comments.” | 12 |


