


Applies to
Summary
The following guide provides a look into the SQL Server instance database index fragmentation reports within the SQL index software.
Description
Maintaining SQL instance indexes is an ongoing and very responsible job assignment. Due to its nature and overall SQL Server configurational structure, indexes are getting constantly fragmented. This in turn has a very negative effect on database performance and can cause some major SQL Server slowdowns.
When database indexes are frequently being defragmented by a scheduled index maintenance activity, their fragmentation percentage is constantly changing. In a production environment, database indexes are always busy and their SQL Server under constant load so the fragmentation level is steadily increasing. With the same principle applied, frequent defragmentation activities against the same indexes are decreasing its fragmentation percentage level.
All those constant changes and different stages of an SQL Server instance index lifecycle can be well documented in a form of a statistical report within the SQL index software.
SQL index fragmentation reports
To see an index fragmentation report, upon starting the tool, move to the Reports tab. Here, under the View toolbar category, several reports are present. Each one provides its own set of statistical details regarding the selected database indexes:

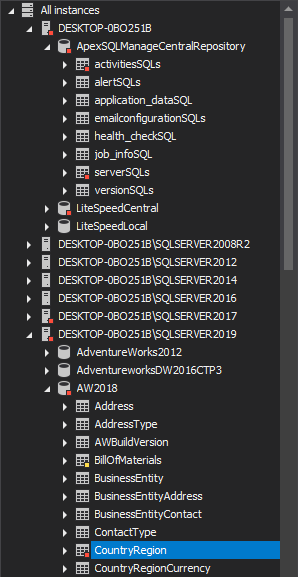
SQL Server instances and their databases are shown in the Server Explorer “tree view” display on the left. The “tree view” display goes all the way to the index level, meaning that statistical report can be seen for a single selected table index:
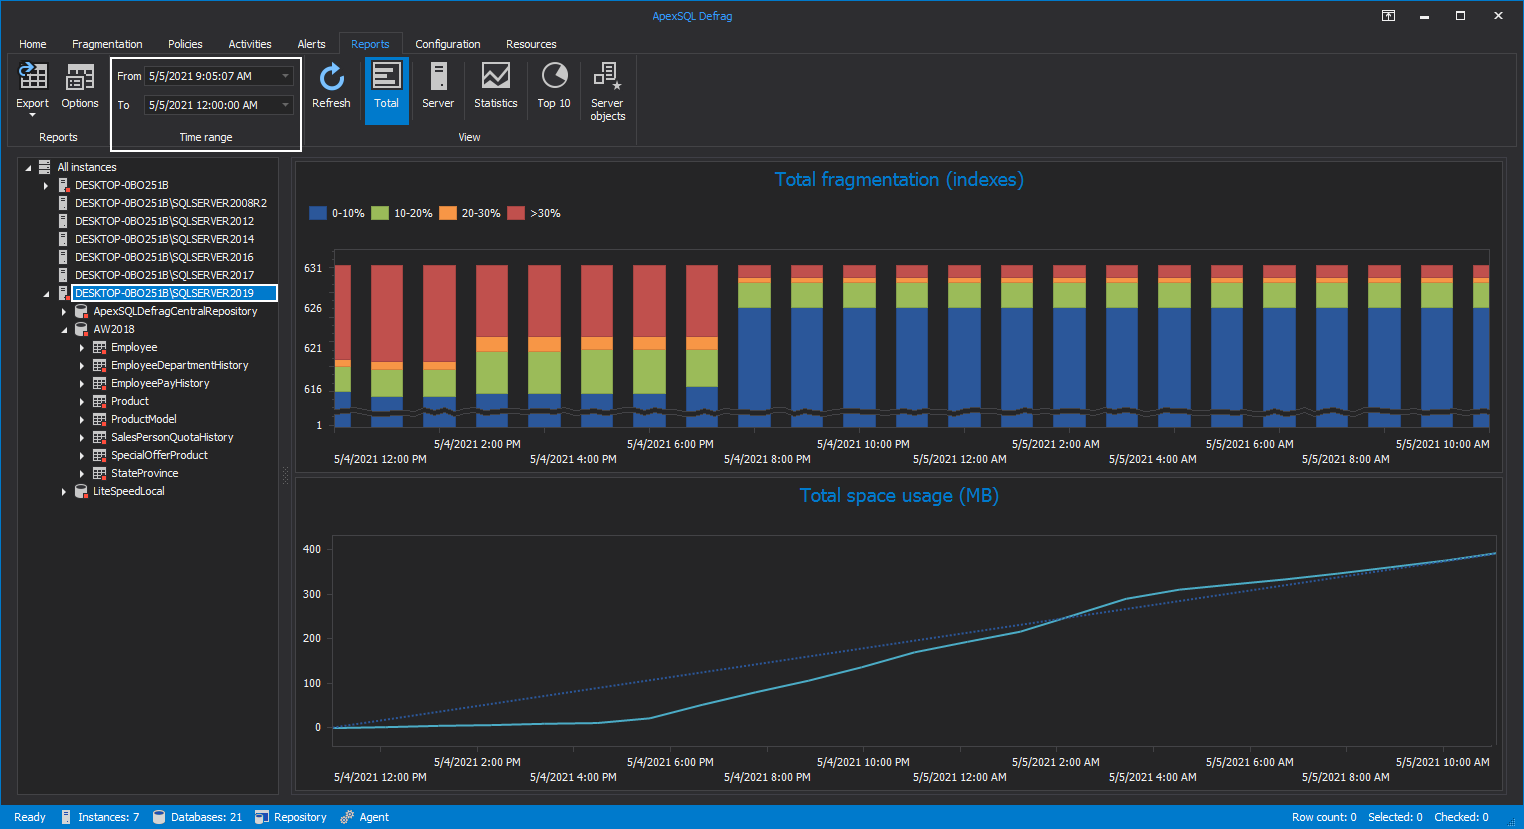
To see an index statistical report, simply select a SQL instance, a set of database indexes, or a single index from the Server Explorer, provide a time range by populating the appropriate boxes in the Time range toolbar category and click the desired report. By default, the Total report is selected:
|
Quick tip: To populate the “time range” filter, from the Time range toolbar category, click the drop-down buttons within the From and To boxes and select the preferred date and time for the statistical visual display. Click the OK button to confirm selection: |
Total report
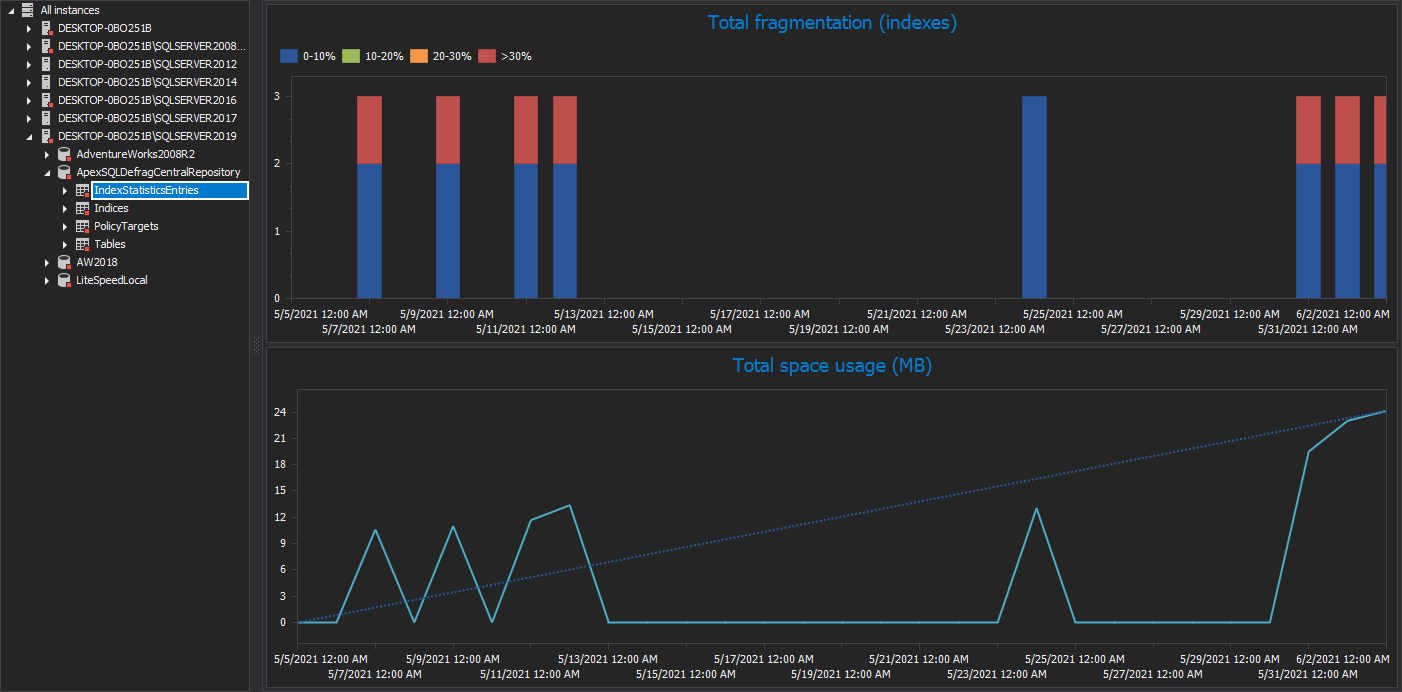
The Total report displays the graphical representation of fragmentation for the selected SQL Server instance from the Server Explorer on the left. Additionally, it shows the disk space usage in megabytes at the selected level, i.e. whether an instance, database, table, or index is chosen in the Server Explorer. If a database table is selected on the left, the total report will display its fragmentation as a graph statistical representation along with the graph display for total space usage at the table level:
Show SQL instance statistics report
To see statistical information about the CPU and Memory usage for selected instance, once the selection is made click the Server button from the View category:
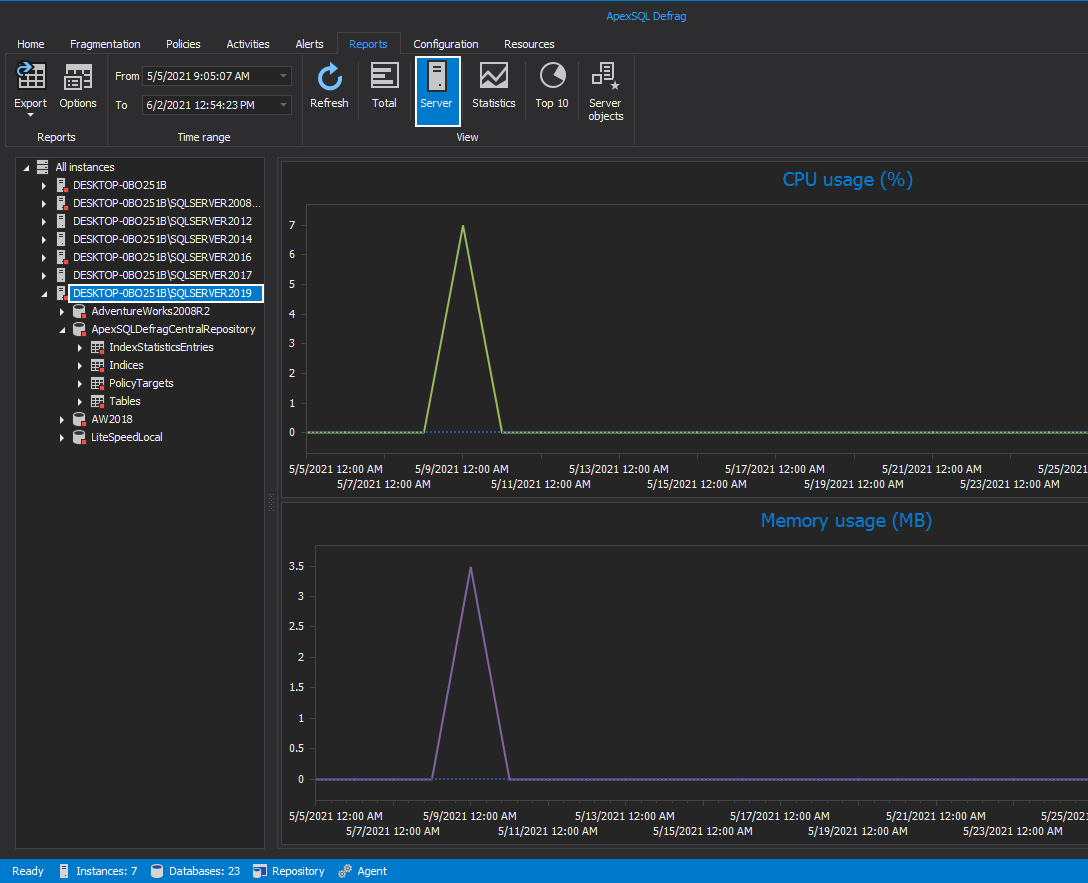
It’s worth noting that this report is active only at the SQL Server instance level, i.e. its option is shown in the View toolbar category only when an instance is selected from the Server Explorer.
Show statistics report
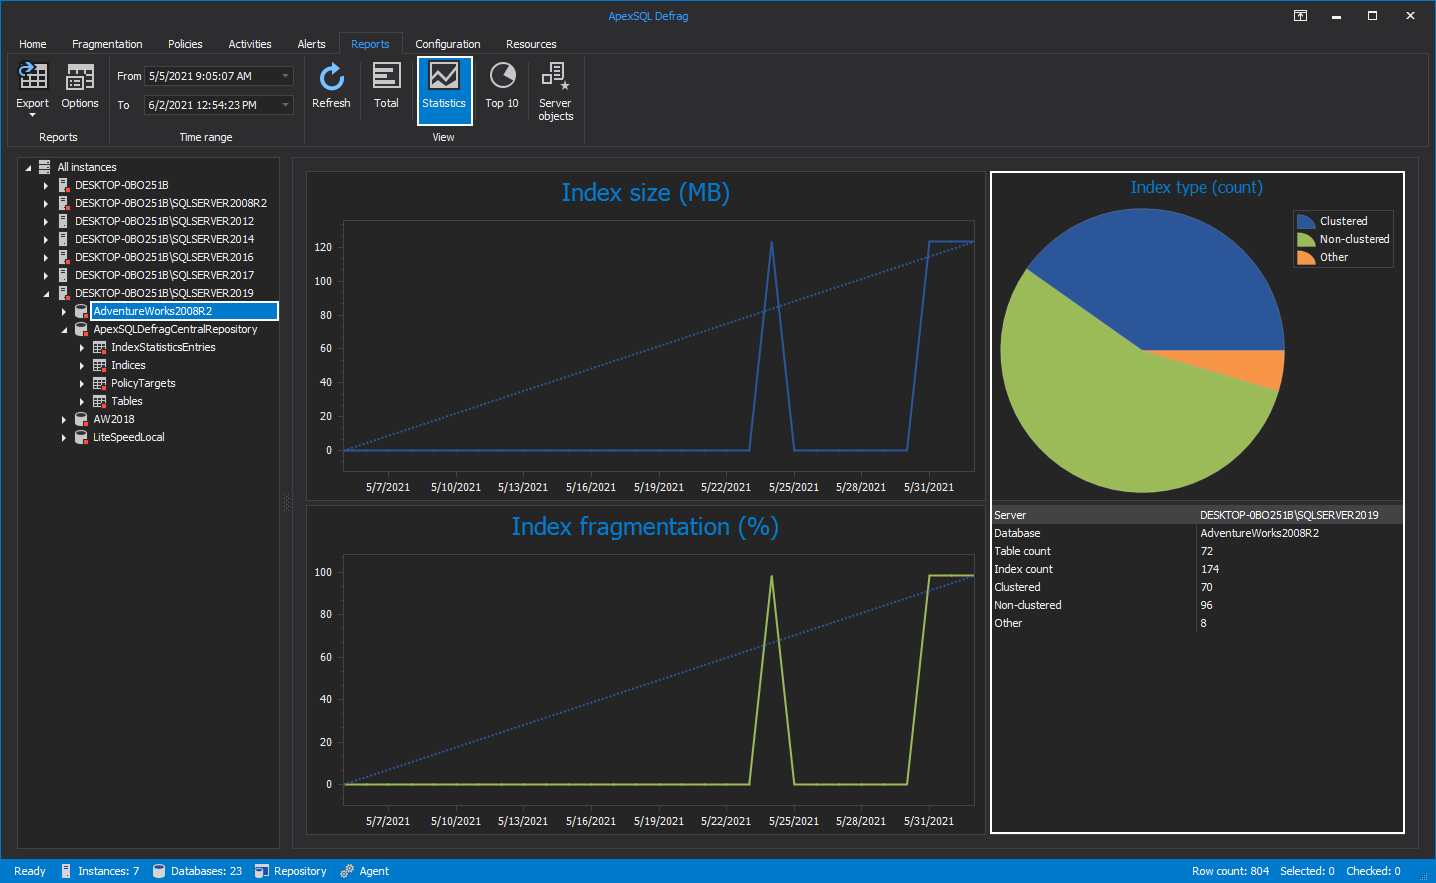
The report displaying the statistical information at different levels about the total size of indexes and total index fragmentation shown in percentage is called the Statistics report. Once the desired selection is made from the Server Explorer, this report can simply be called by clicking the Statistics button from the View category. Along with the mentioned two graphs, it also shows the Index type count conveniently presented in the form of the pie graph and using color to distinguish its different types of indexes from one another. Below the Index type pie graph the graph statistics for the selected level is shown by numbers:
Top 10 report
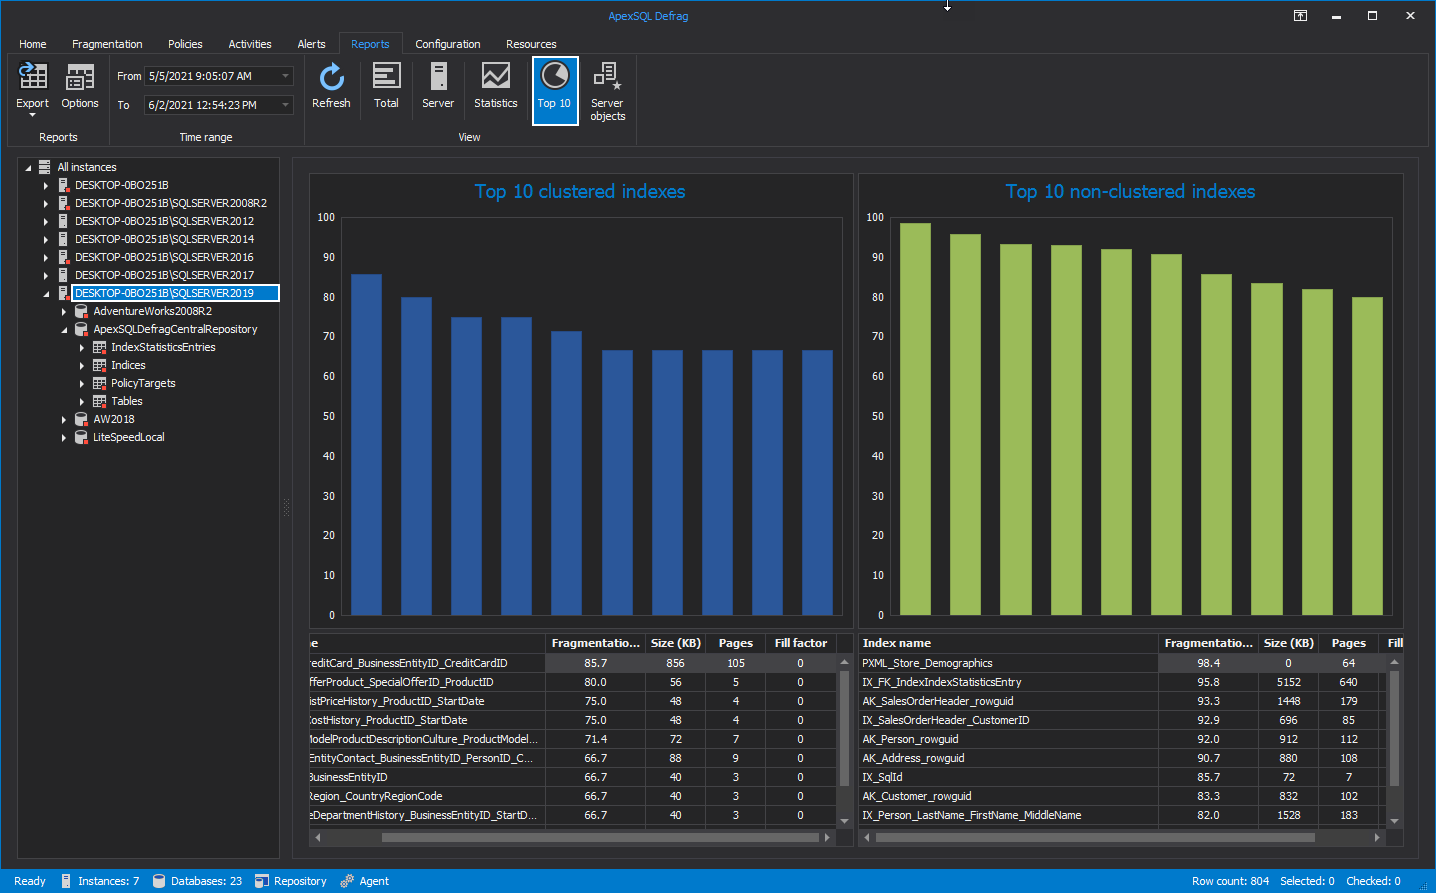
The next report shows the top 10 clustered and top 10 non-clustered indexes for selected SQL Server instance, database, or table. Below the graphs, presented are the statistics by numbers for all top 10 indexes including its fragmentation percentage, size in KB, number of pages, and its fill factor. The same applies to both, clustered and non-clustered indexes:
|
Quick tip: When hovering over any of the top 10 indexes, its statistics are conveniently shown. These statistics include index type, its name along with the name of the SQL instance, database, and table this specific index belongs to. Additionally, its fragmentation percentage is displayed as well: |
SQL Server instance index fragmentation export
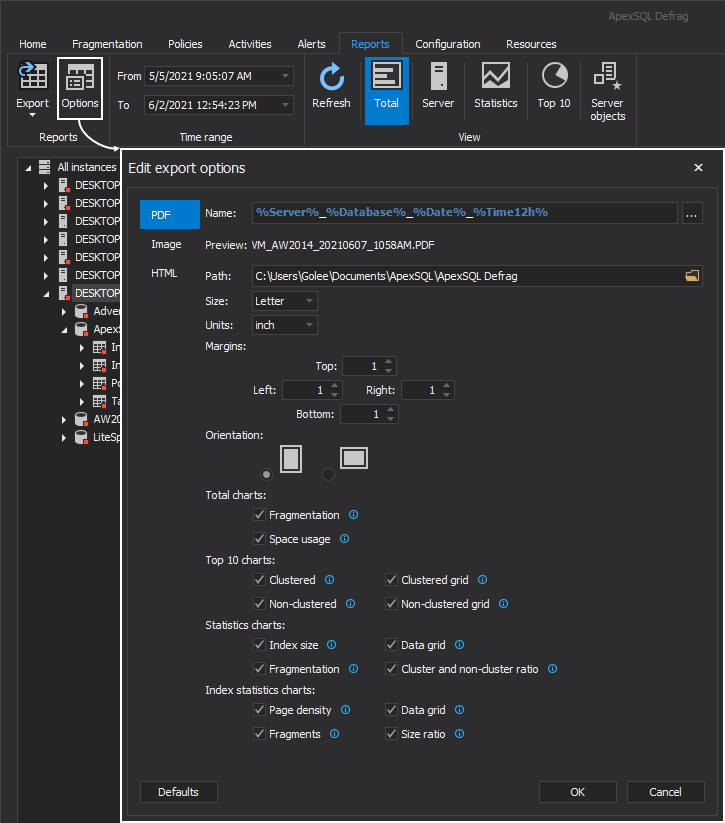
The SQL index software allows the export of index fragmentation reports in the following formats: PDF, IMG, HTML, CSV, and XML. Before initializing this operation, PDF, IMG, and HTML export options can be easily configured to desired output by clicking the Options button in the Reports toolbar category:
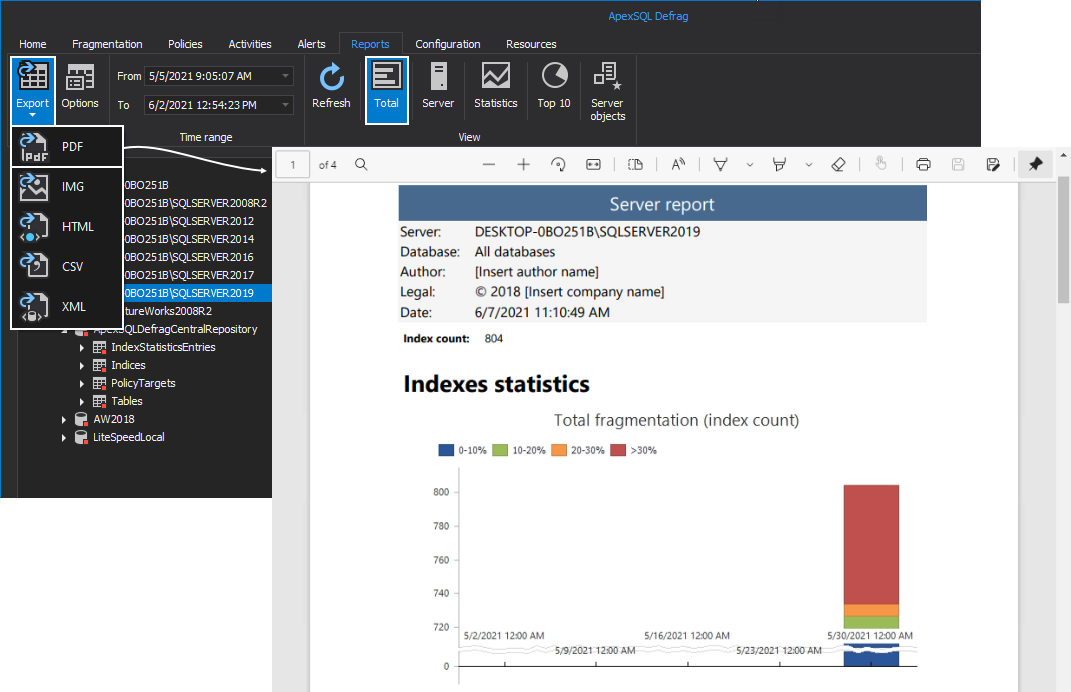
To export an index fragmentation report, select the preferred SQL Instance object from the Server Explorer, choose the desired report from the View category, and from the Export drop-down menu click any of the displayed outputs:
Conclusion
With the help of the SQL index application, the fragmentation percentage of our SQL Server instance indexes can be easily monitored, its reports can be easily viewed and exported for a possible presentation, or when a specific fragmentation state needs to be captured and archived.


