Applies to
Summary
The following guide provides an overview of different SQL Server instance index scanning operations with the goal of determining the exact index fragmentation percentage level.
Description
SQL Server index fragmentation is a natural occurrence that is the result of database performance degradation. It comes in two different forms:
- Internal fragmentation – occurs when there is a lot of empty space on a data page
- External fragmentation – occurs when there is no match between the logical order of pages in an index and the physical order of pages in a data
The more data is being modified in a database the more its indexes get fragmented.
Therefore, it is vital to have an index fragmentation percentage level fresh and updated before any of the index maintenance operations are being performed against those indexes.
Keep index fragmentation percentage level up to date
To ensure that the index fragmentation percentage level of a SQL Server instance is fresh and updated, head over to the Fragmentation tab and from the Analyze drop-down menu choose one of the two presented analysis. The scan analysis will be performed, and its results are shown in the index grid based on the default selected scan mode and grid filters:
- Fast – scans last known index fragmentation state in CRD, the Central Repository Database
- Deep – scans for current index fragmentation state:
|
Quick tip: The mentioned default scan mode settings can be easily configured in few simple steps but more on that in following sections. |
Different types of index fragmentation scanning
When it comes to different scan types, there are three modes to consider from:
- Limited – the default mode in SQL index software that collect limited information about the index fragmentation, not causing any performance issues to the system. It is the fastest mode
- Sampled – this scan mode takes a sample portion of the SQL Server instance index and based on that sample displays approximate fragmentation information of all index pages that the sample was taken from
- Detailed – this mode scans all index pages and displays its fragmentation statistics. Depending on a size and number of index pages, it may take more resources and, in some extreme cases, may lead to some performance issues down the line. However, it displays the most accurate statistics
Grid index fragmentation filters
SQL Server instance index fragmentation percentage level can be listed in two different grid displays:
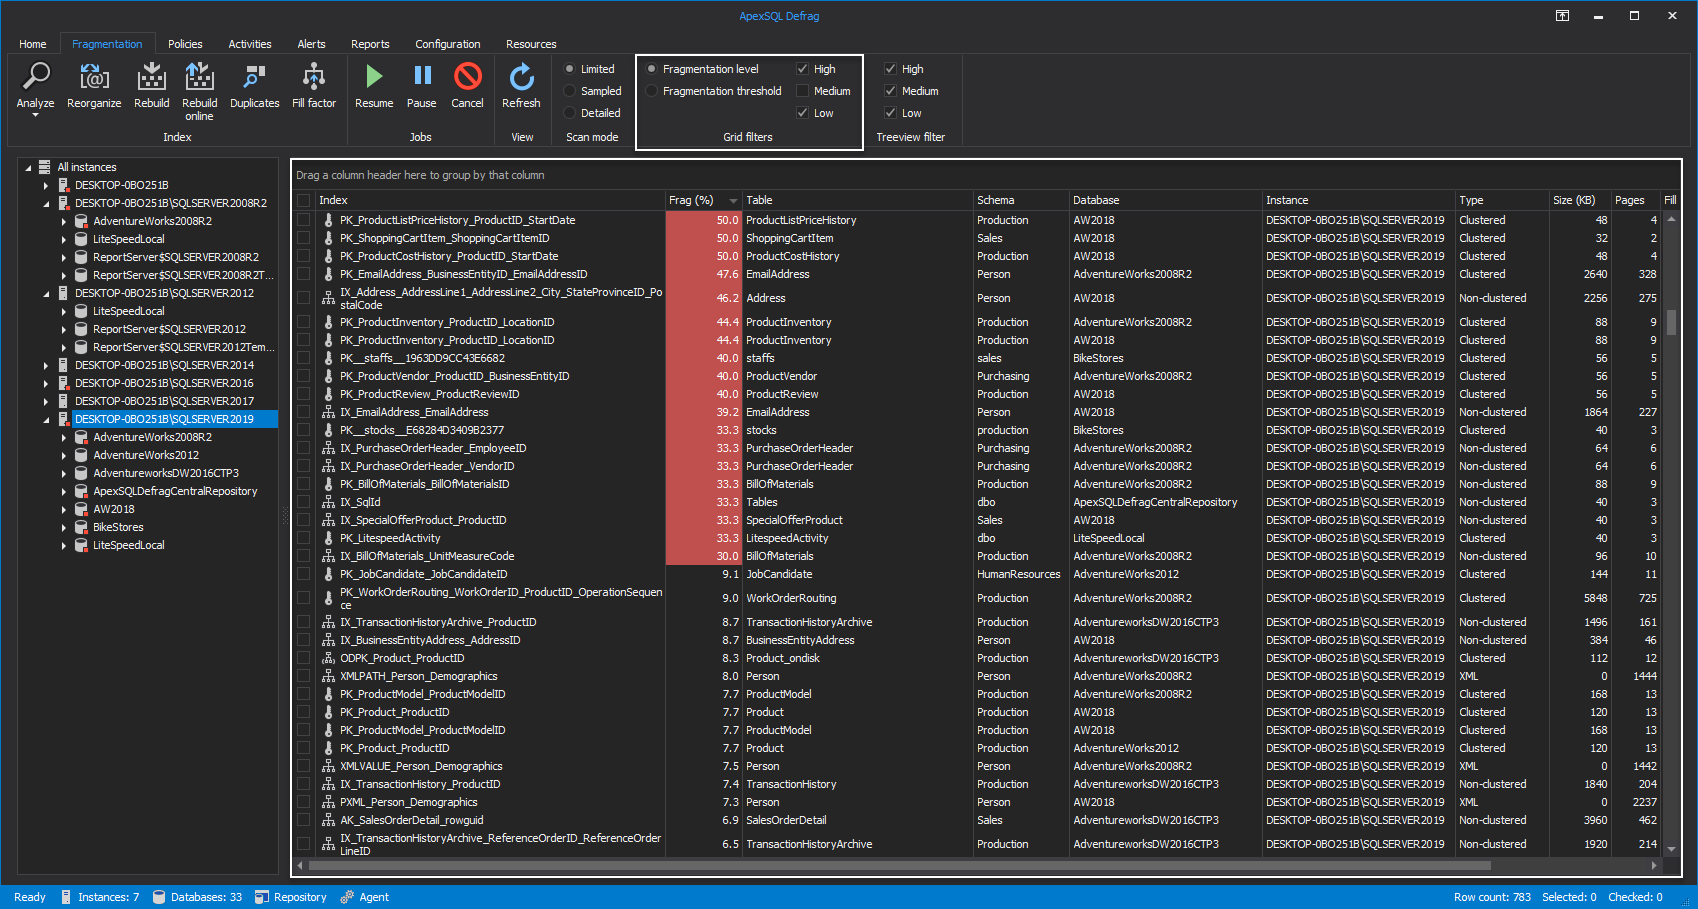
- Fragmentation level – show indexes with high, medium and/or low percentage of index fragmentation
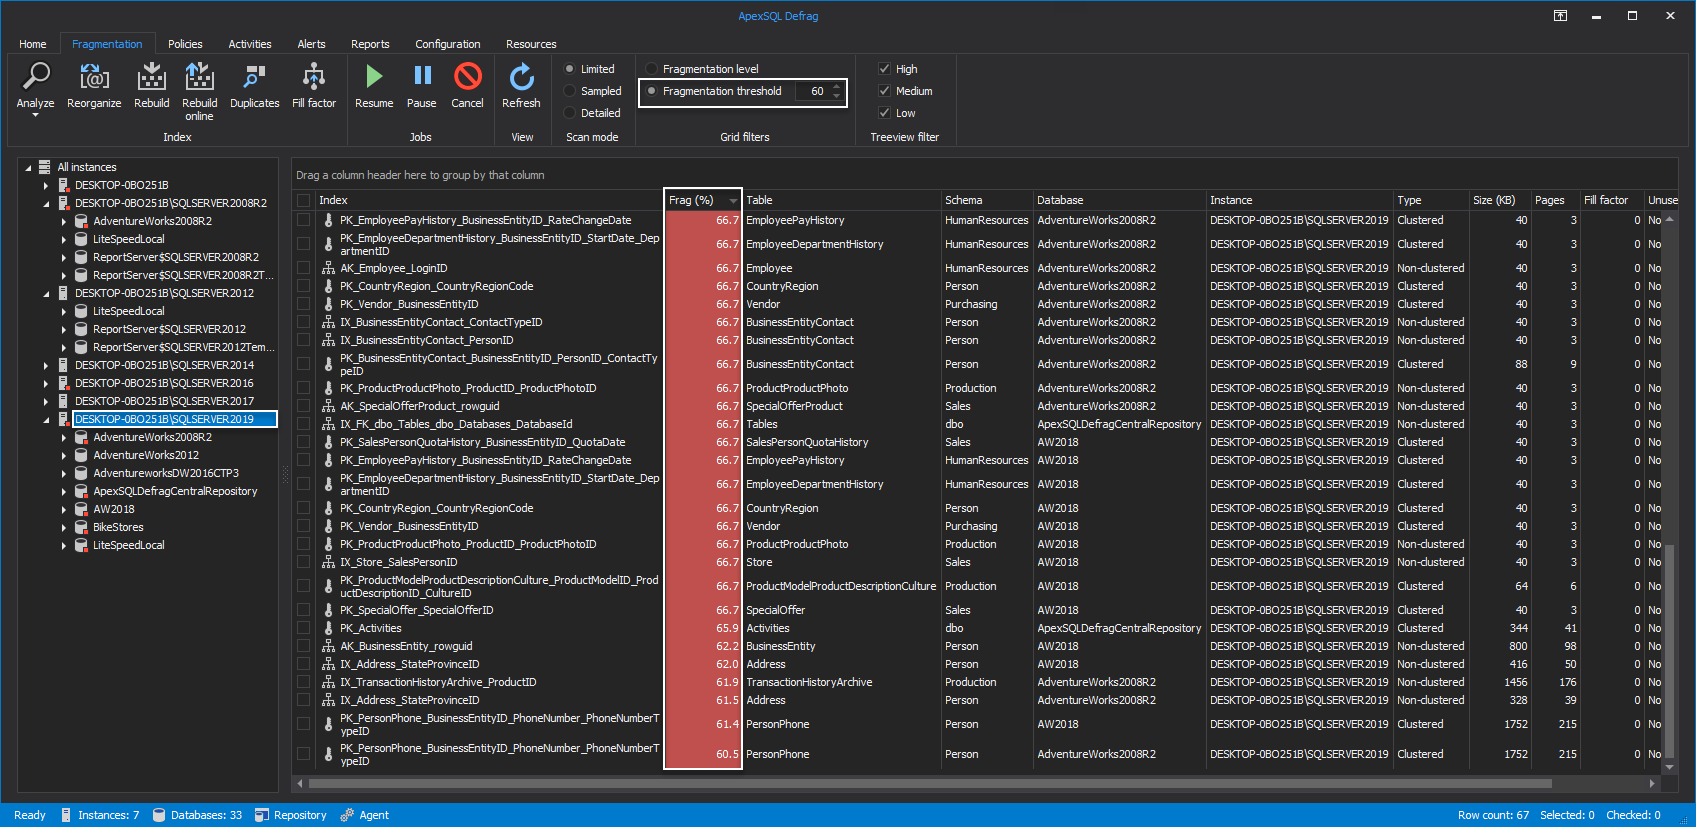
- Fragmentation threshold – only shows indexes with fragmentation percentage above specified value
Fragmentation level grid filter
Once a SQL instance, its databases or indexes are selected from the server explorer, from the Grid filter category one of three fragmentation level options can be chosen:
- High – in grid only shows the high fragmented indexes, by default all indexes with fragmentation over 30%
- Medium – medium fragmented indexes, with fragmentation percentage between 10% and 30% are shown in the grid
- Low – only SQL Server instance indexes with low percentage level of fragmentation, up to 10%, are shown:
|
Quick tip: Fragmentation level threshold can be easily set with desired custom values, by moving to the Configuration tab where from the View tab of the Options window High, Medium and Low values can be configured: |
Fragmentation threshold grid filter
When the Fragmentation threshold is set to a specific value, then index grid view will display only indexes with fragmentation level percentage above that value:
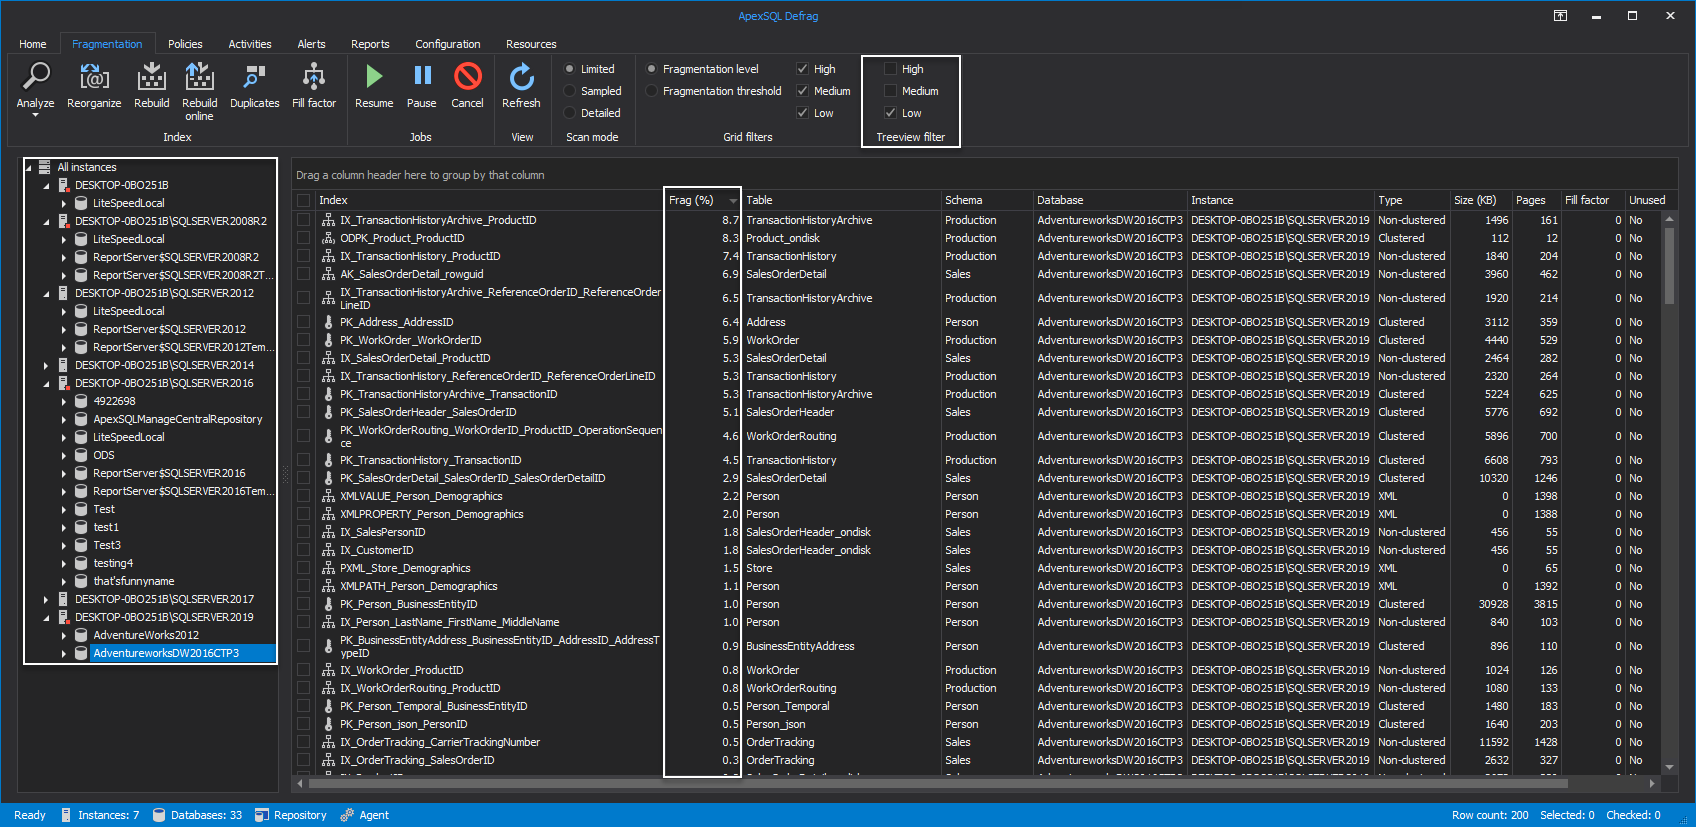
Server explorer Treeview filters
When any of Treeview filters are unchecked, SQL Server instance databases with the unchecked filter will be hidden from the server explorer and no longer available for visual display. The following image shows that only databases with Low fragmented indexes are selected in the server explorer Treeview filter to be shown:


