


Applies to
ApexSQL Monitor
Summary
This article explains how to use the custom SQL script alert action in ApexSQL Monitor, use the preset action tags in a script and test it, including examples of a few SQL scripts to use to assist in performance monitoring.
Description
Being a part of a larger group of custom alert actions, Create SQL script is the functionality in ApexSQL Monitor that allows executing customized SQL scripts when some alert triggers.
|
Quick info: All the alert actions (Create SNMP trap , Create command, and mentioned) relate to alert triggering events. These custom actions in alerts won’t be fired if there is no alert activity. |
1. How to create a SQL script alert action in ApexSQL Monitor
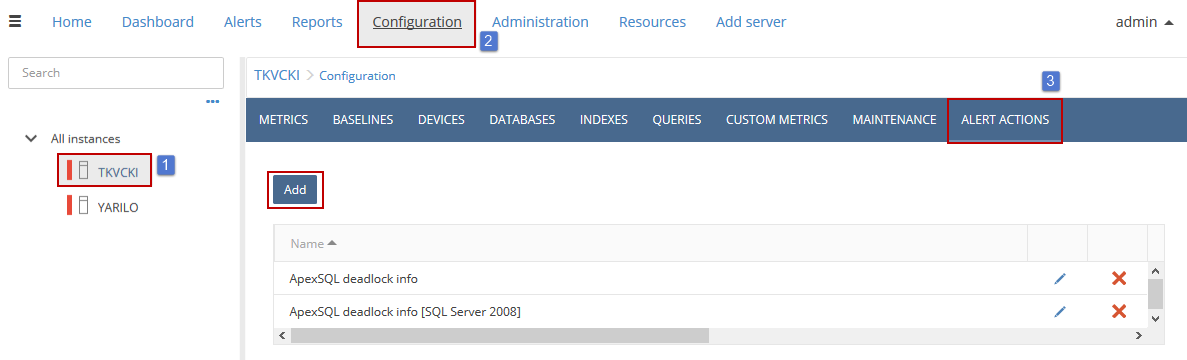
To use the SQL script alert action, first choose a desired SQL Server instance, and navigate to the Configuration subsystem and Alert actions tab. Then, add a new action profile, as in the picture below:
Name the new alert action profile My custom alert, and select Create SQL script option:
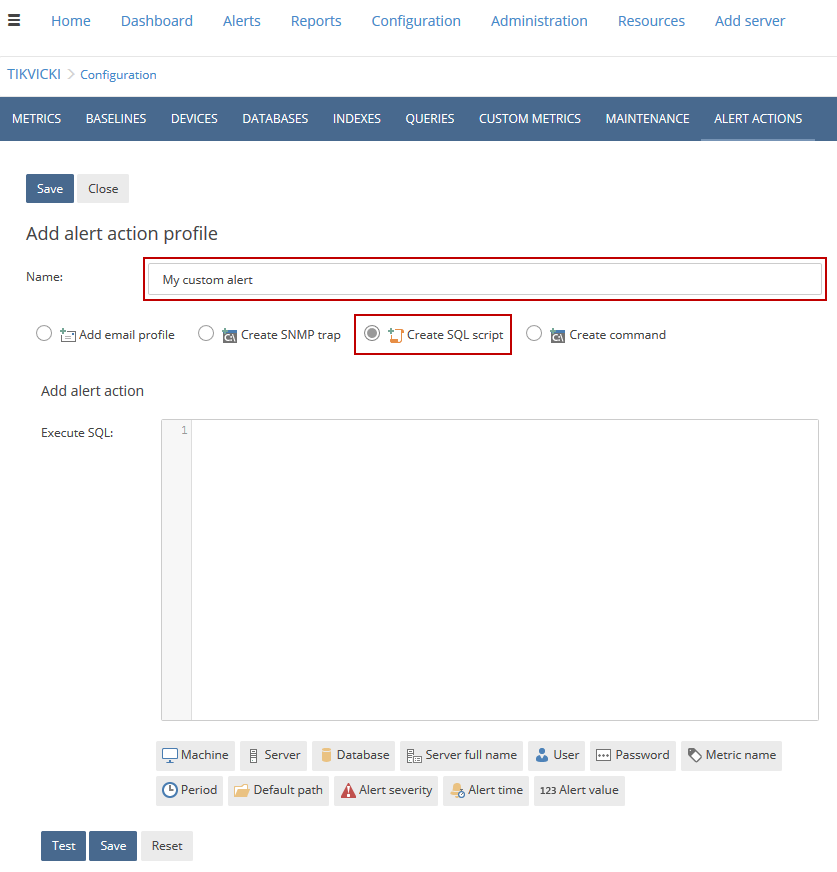
Initially, user will be prompted to add an email profile, by default.
Elements of the SQL script execution panel
This panel consists of two components: the SQL script input field and preset action tags (below).
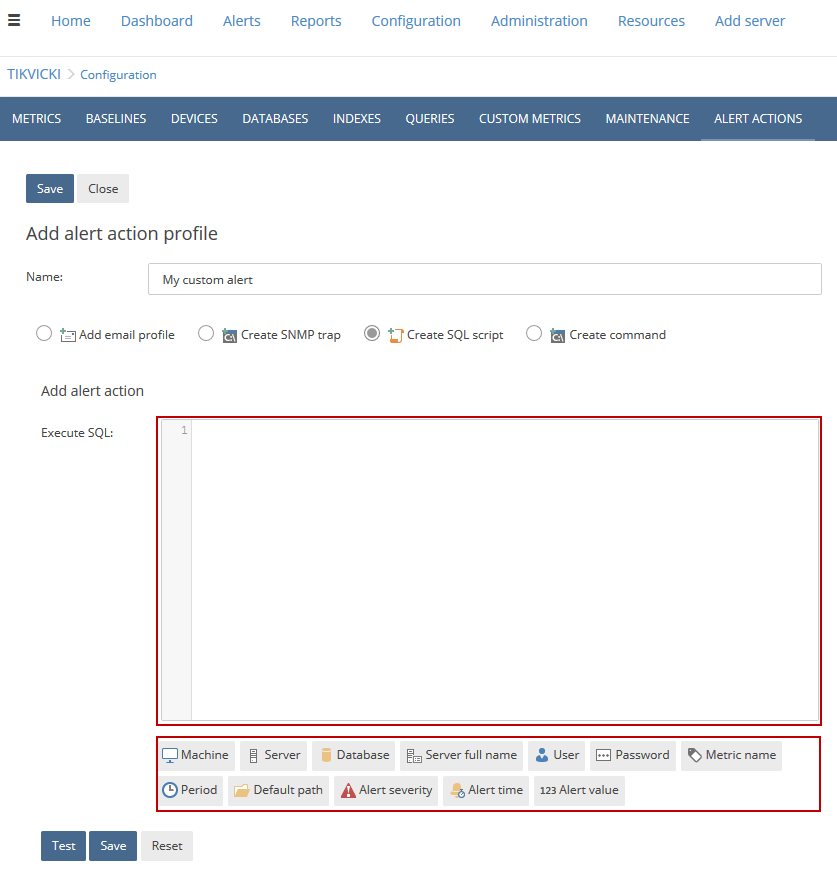
Action tags like Server full name, Alert severity and others are parameters which can be used in the script composition, and they represent the information that retrieves directly from the alerting event.
Testing the alert action
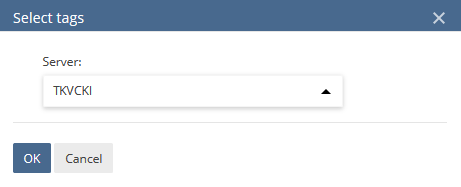
After the input of a desired SQL statement, press the Test button. If the action tags are included in a script, the Select tags modal dialog will appear (for this case, the %Server% action tag is selected):
In both cases, after successful execution, the message will appear:
Afterwards, the alert action profile My custom alert can be saved, modified according to the needs and used further.
The list of available alert actions profiles can be reviewed (and edited, if needed) after saving:
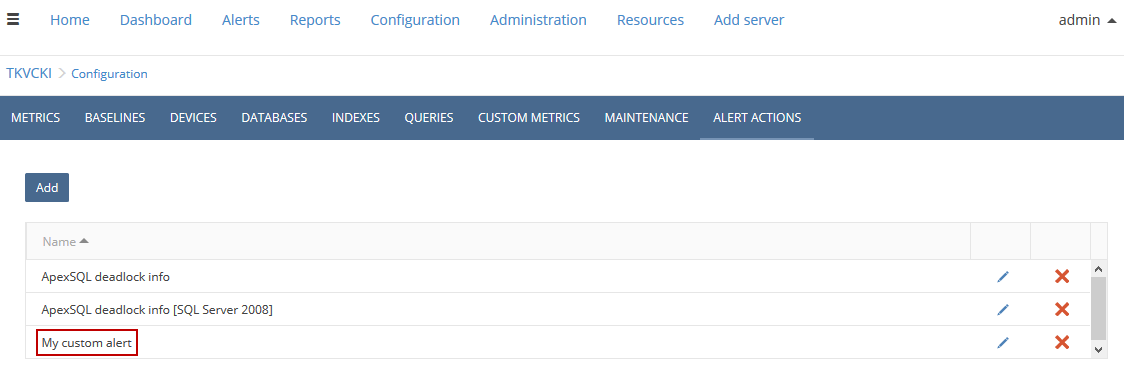
Besides custom alert action profile , there are two other, pre-defined profiles: ApexSQL deadlock info and ApexSQL deadlock info [SQL Server 2008].
To include the custom alert action profile, set it within the Configuration subsystem in corresponding field:
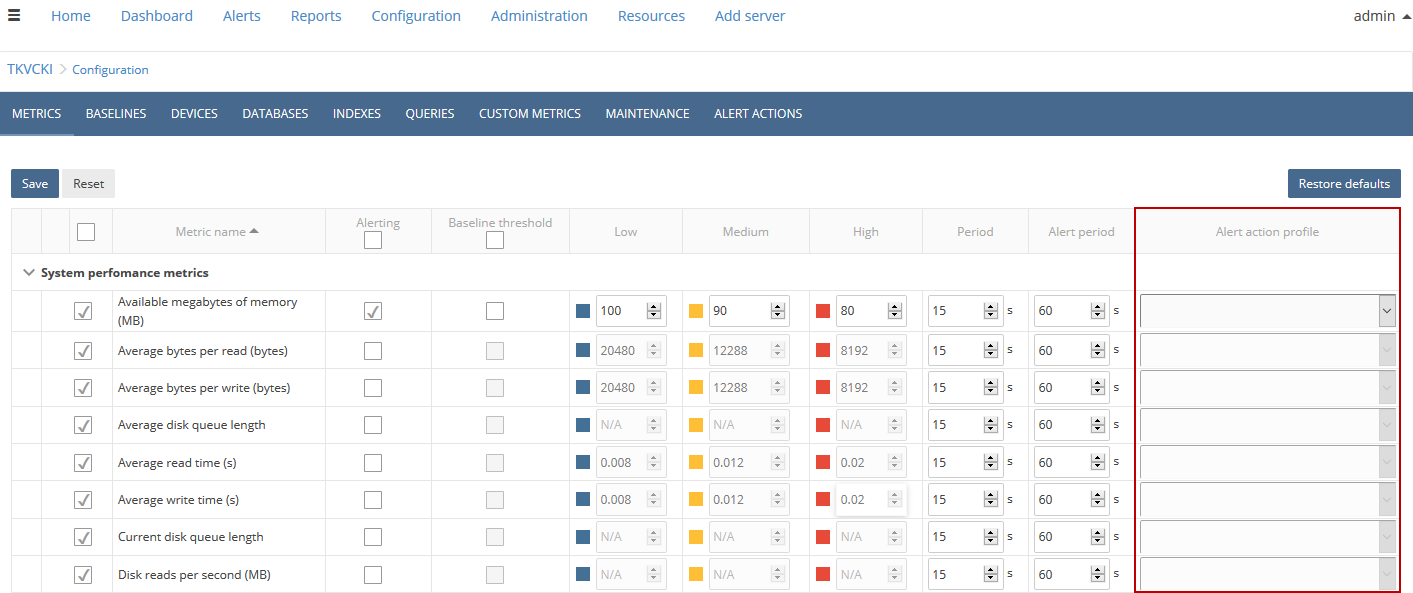
If alerting is enabled for the specific metric (like for Available megabytes of memory (MB) metric on the picture above), any of the alert action profile can be embedded.
2. Examples of SQL scripts to use within Create SQL script alert action
Beside the provided examples, users can execute their own SQL scripts, according to their needs, on a local or remote machine, as long as specified permissions and requirements are set for utilizing the remote machine, and scripts are valid.
Importing the information of the alerting event into custom database
First, create a database and corresponding table, with this T-SQL code:
-- CREATE DATABASE
CREATE DATABASE CustomAlerts

-- USE DATABASE TO CREATE TABLE
USE CustomAlerts

-- CREATE TABLE
CREATE TABLE dbo.AlertEvents (
	Machine NVARCHAR(20)
	,Server_Name NVARCHAR(20)
	,Database_Name NVARCHAR(20)
	,Server_Full_Name NVARCHAR(40)
	,User_Name NVARCHAR(20)
	,User_Password NVARCHAR(20)
	,Alert_Severity NVARCHAR(8)
	,Alert_Time NVARCHAR(50)
	,Alert_Value INT
	,Metric_Name NVARCHAR(50)
	,Default_Path NVARCHAR(100)
	);
As it can be seen, within the table AlertEvents are columns that are related to the action tags from ApexSQL Monitor.
After creation of the database and table, set the Create SQL script alert action, and use this SQL script in SQL input field:
USE [CustomAlerts]

INSERT INTO [dbo].[AlertEvents] (
	[Machine]
	,[Server_Name]
	,[Database_Name]
	,[Server_Full_Name]
	,[User_Name]
	,[User_Password]
	,[Alert_Severity]
	,[Alert_Time]
	,[Alert_Value]
	,[Metric_Name]
	,[Default_Path]
	)
VALUES (
	'%Machine%'
	,'%Server%'
	,'%Database%'
	,'%ServerFullName%'
	,'%User%'
	,'%Password%'
	,'%AlertSeverity%'
	,'%AlertTime%'
	,'%AlertValue%'
	,'%MetricName%'
	,'%DefaultPath%'
	);
|
Quick tip: Action tags strings can be included in a script without apostrophes (%Machine% instead of ‘%Machine%’) |
It was stated before that only an alert triggering event will execute the script, if it is saved as the alert action profile and set as an alert action. There is a possibility to execute script, and review the sample results by clicking the Test button, though.
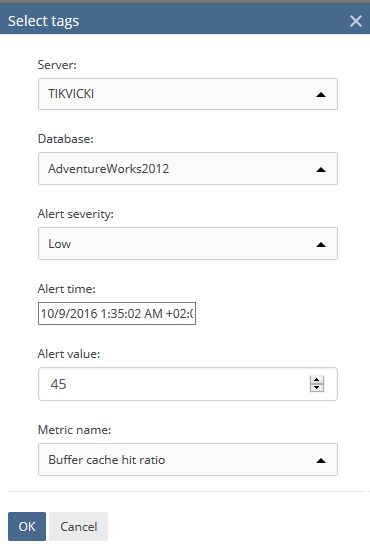
In that case, when all of the action tags are present in the script, Select tags dialog will have some additional drop-down menus, which represent the values of the particular action tags (Database, Alert severity, Alert time, Alert value and Metric name).
Set test data like in picture below, and then press OK:
After executing this action, review the results:
SELECT *
FROM dbo.AlertEvents
This result should appear:

|
Quick tip: The ServerName value here is represented with a dot (.), because of the SQL server settings, when the SQL server name is the same like machine’s name. This can be solved, for illustrating purpose, by putting the actual name of the server in the form of string in the script (‘<Name of the server>’), instead of the %Server% action tag |
Import data from stored procedures and Extended events objects
These examples of the SQL scripts will include the who2 stored procedure, as a diagnostic tool for determining system slowdowns occurrence, and also Extended events objects, both queried through the execution of stored procedures. These scripts help in detailed troubleshooting or identifying specific problems in SQL server performance. Stored procedure who2 provides an information which database used which command and when it is executed. The Extended events session (included in this article) handles an information just on active session occurring in monitored SQL server process, and its memory consumption (ApexSQL Monitor constantly gathers the values only with Target server memory and Total server memory metrics, which are cumulative values).
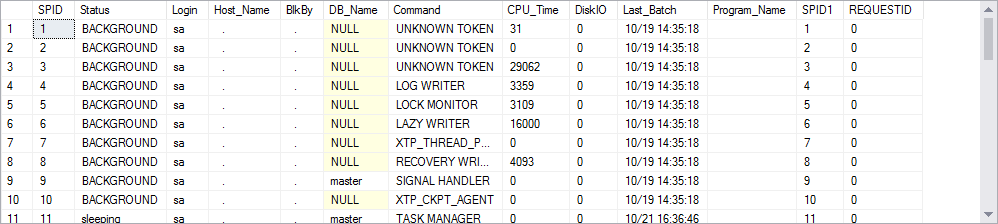
To gather the information from the who2 stored procedure, first declare the temporary table with exact columns from the execution result of the stored procedure, and then insert the data from temporary table to an actual table, within the script in ApexSQL Monitor
DECLARE @temp TABLE (
	SPID INT
	,STATUS NVARCHAR(50)
	,LOGIN NVARCHAR(50)
	,HostName NVARCHAR(50)
	,BlkBy NVARCHAR(50)
	,DBName NVARCHAR(50)
	,Command NVARCHAR(50)
	,CPUTime BIGINT
	,DiskIO INT
	,LastBatch NVARCHAR(50)
	,ProgramName NVARCHAR(50)
	,SPID1 INT
	,REQUESTID INT
	);

INSERT @temp
EXEC sp_who2;

SELECT *
INTO dbo.WhoDidThis
After execution of the script, check the results by querying dbo.WhoDidThis to view the logged data
|
Quick info: Prerequisites to use Extended events objects include VIEW SERVER STATE permission in SQL Server |
Create a stored procedure for gathering information on Extended events session:
--creates stored procedure
CREATE PROCEDURE XESessions
AS
SELECT *
FROM sys.dm_xe_sessions
Then set this script as the alert action in ApexSQL Monitor:
--declares temporary table, executes procedure and inserts results in the new table dbo.XE
DECLARE @temp TABLE (
	Address NVARCHAR(50)
	,NAME NVARCHAR(50)
	,Pending_Buffers INT
	,Total_Regular_Buffers INT
	,Regular_Buffer_Size BIGINT
	,Total_Large_Buffers INT
	,Large_Buffer_Size BIGINT
	,Total_Buffer_Size BIGINT
	,Buffer_Policy_Flags INT
	,Buffer_Policy_Desc NVARCHAR(50)
	,Flags INT
	,Flag_Desc NVARCHAR(50)
	,Dropped_Event_Count INT
	,Dropped_Buffer_Count INT
	,Blocked_Event_Fire_Time INT
	,Create_Time NVARCHAR(100)
	,Largest_Event_Dropped_Size INT
	,Session_Source NVARCHAR(50)
	);

INSERT @temp
EXEC XESessions;

SELECT *
INTO dbo.XE
FROM @temp
Results should appear like this:

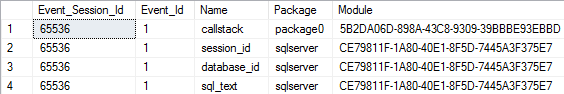
Also, the information can be gathered from Extended events session actions, by following the similar steps, create the stored procedure:
CREATE PROCEDURE XESessionsActions
AS
SELECT *
FROM sys.server_event_session_actions
and then set the alert action in ApexSQL Monitor:
DECLARE @temp TABLE (
	Event_Session_Id NVARCHAR(50)
	,Event_Id INT
	,NAME NVARCHAR(50)
	,Package NVARCHAR(50)
	,Module NVARCHAR(100)
	);

INSERT @temp
EXEC XESessionsActions;

SELECT *
INTO dbo.XE2
FROM @temp
FAQs
Q: Can I execute multiple scripts at once?
A: Yes, by creating a desired number of alert actions in a single alert action profile (like shown below)
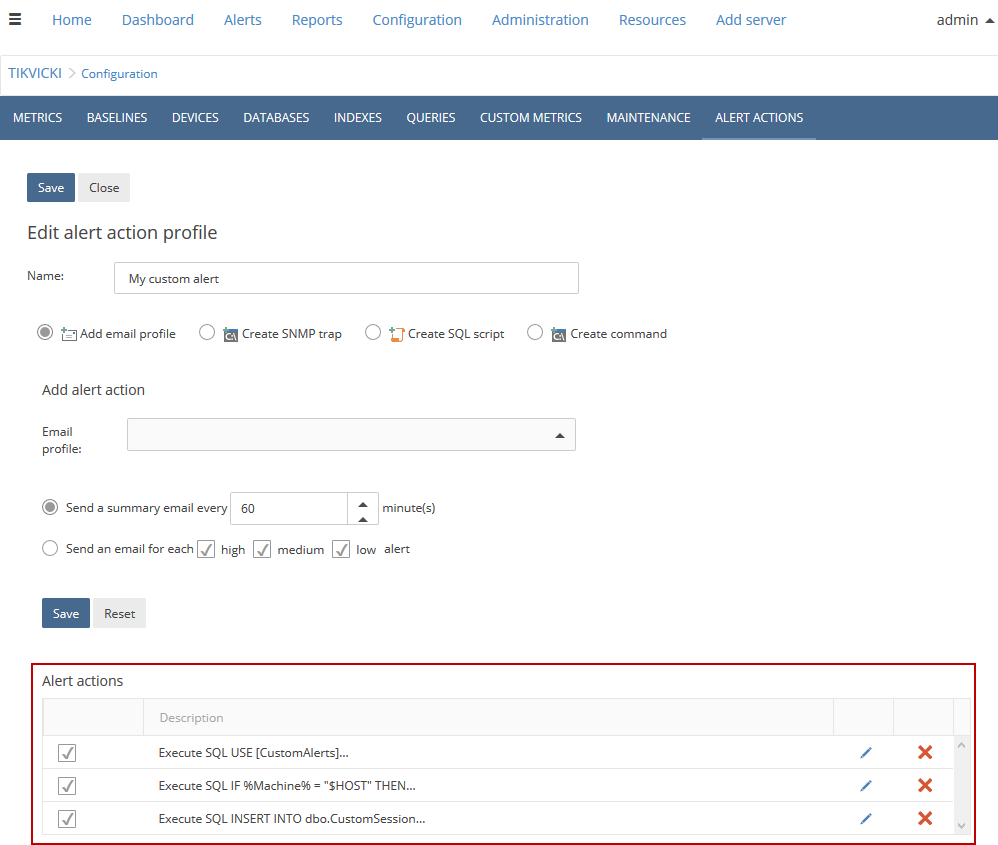
When alert trigger, SQL scripts are executing sequentially.
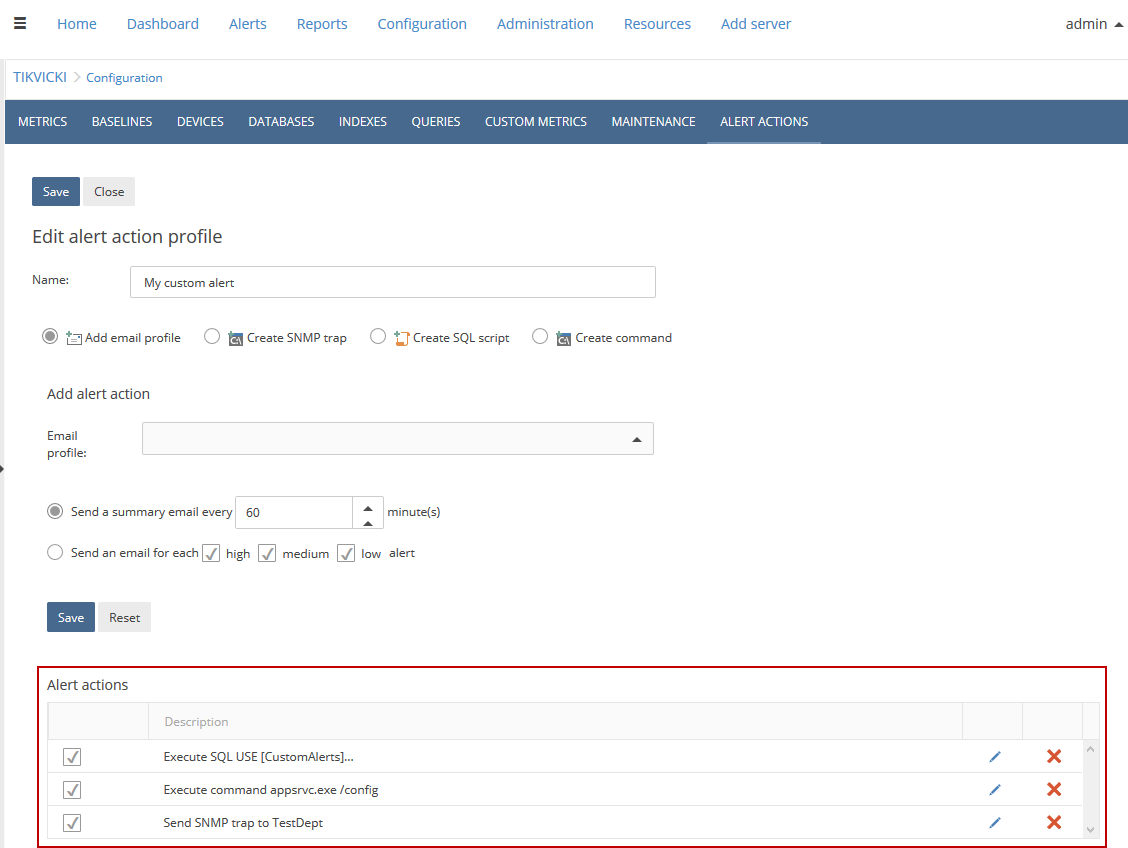
Q: Is it possible to combine different alert actions functionalities (SNMP trap, custom SQL script and custom command) in a single alert action profile?
A: Yes, it is possible, if SQL script and command inputs are valid and SNMP profile is set properly. ApexSQL Monitor will eventually display specific error message on invalid syntax or point to an improper usage of specific script or command.
Q: What if part of the script fails during the execution?
A: Execution made within a transaction and therefore the entire SQL script will be rolled back.
Q: Where does the SQL script execute after the alert action is saved and set, and alert triggers?
A: The SQL script executes on a server from where alert raised.
Q: Could I export the results from a stored procedure used in a script into CSV/TXT file from ApexSQL Monitor?
A: It is possible to export the results of any stored procedure into TXT file directly from ApexSQL Monitor, with this script:
DECLARE @cmd VARCHAR(1000)
SET @cmd = 'bcp "EXEC sp_who2" queryout "c:\<file-name>.<csv or txt>" -c -UTF8 -T -Slocalhost'
EXEC master..xp_cmdshell @cmd
|
Quick tip: Instead of sp_who2, any system-based or custom stored procedure can be included in the example of script above |
ApexSQL Monitor action tags overview
| Name | Variable | Description |
| Machine | %Machine% | Local or remote machine name where alert triggered |
| Server | %Server% | Local or remote SQL server instance name |
| Database | %Database% | Database name |
| Server full name | %ServerFullName% | Host Machine Name\SQL Server name |
| User | %User% | User which account is connected to the machine where alert triggered |
| Password | %Password% | Password string |
| Alert severity | %AlertSeverity% | Severity of the alert |
| Alert time | %AlertTime% | Date/time stamp when alert triggered |
| Alert value | %AlertValue% | Threshold value which triggered alert |
| Metric name | %MetricName% | Name of the metric |
| Default path | %DefaultPath% | Default path in ApexSQL Monitor folder which stores the alert actions |


