


Applies to
ApexSQL Monitor
Summary
This article explains how to review and resolve triggered alerts and generate summaries using Reports feature.
Description
Occasionally, some unattended event occurs, with values above or below some metric’s preset alert threshold. In such cases, alerts for that metric are triggered and ApexSQL Monitor displays information to that effect, based on severity, directly on the dashboard.
To see the status and number of the alerts for every one of the monitoring areas (system, database, query, waits etc.), select a desired SQL server instance, and Dashboard will display, as shown below:
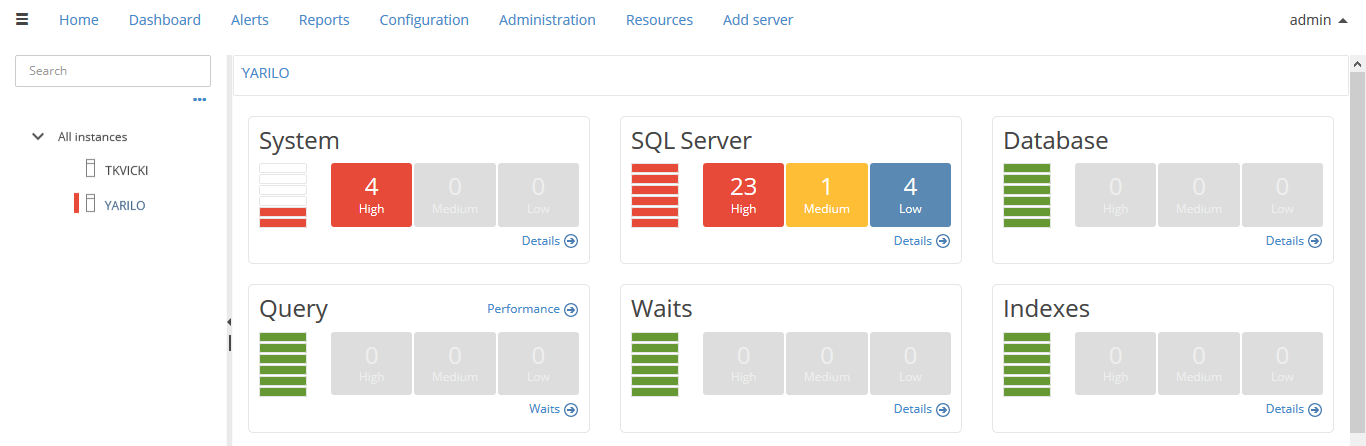
Over time, a number of triggered alerts will be collected. To make use of such alerts they need to be made actionable, by being resolved, and then removed from the current alert list. ApexSQL Monitor offers features to assist in the reviewing, resolving and closing of alerts.
Reviewing alerts
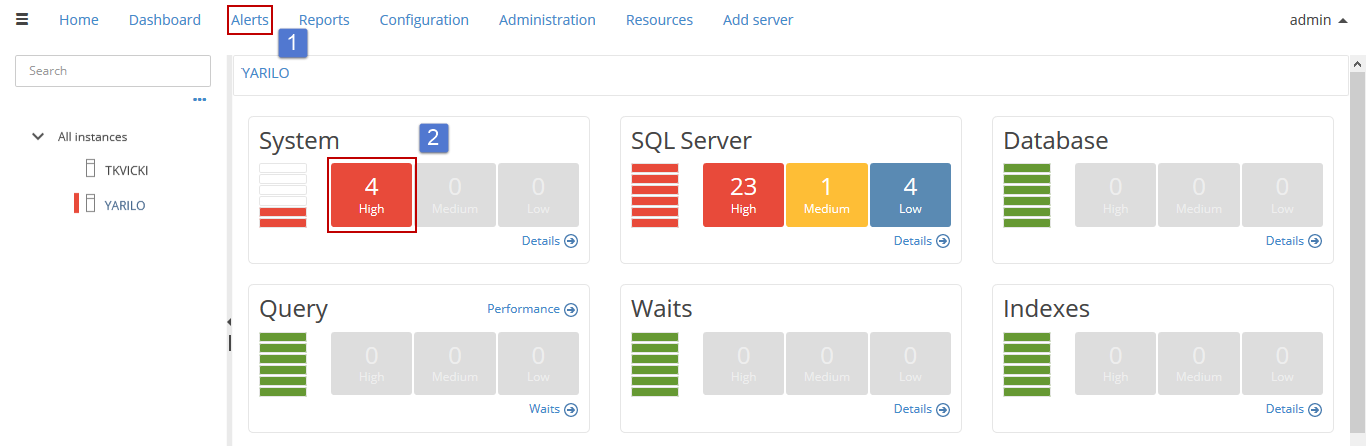
To start a review, navigate to the Alerts subsystem, or click directly on any of the alert counters on the Dashboard, or on charts (when they appear):
To review alerts from all monitored instances, choose All instances in SQL server pane, as shown below:
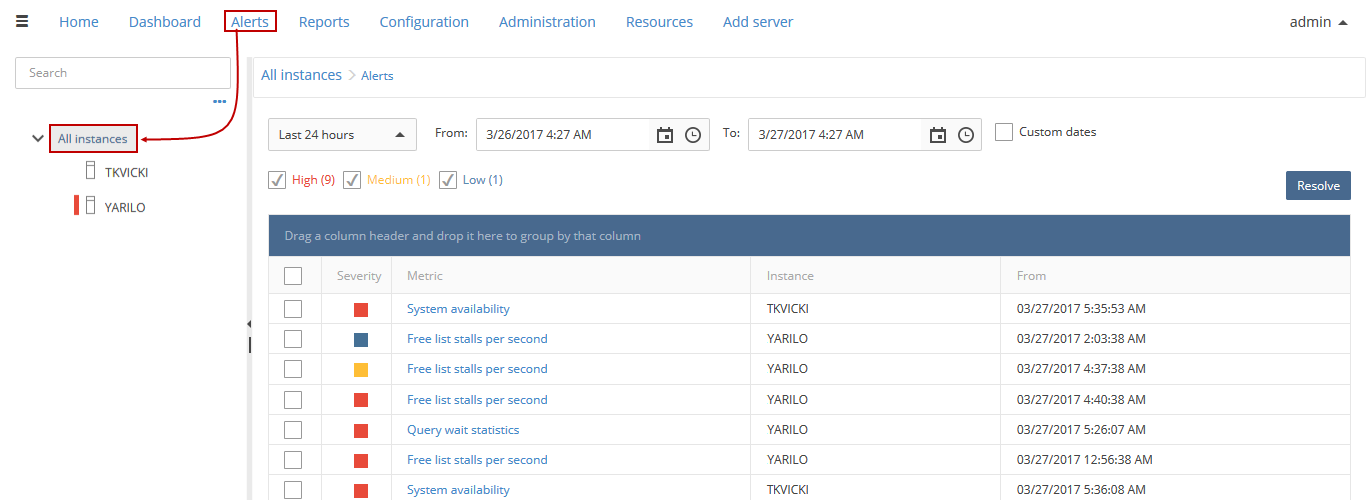
As shown above, the metrics list with corresponding alerts is present, including general information like alert severity, metric name, instance on which alert raised, and timestamp when the alert arose (column From). Above this list, there are also controls for alerts filtering by severity, a time interval picker, which displays all raised alerts, alerts that raised in last 24 hours or last 7 days from the beginning of monitoring. To define custom date/time span, use From-To controls. Additionally, when enabled, Custom dates option considers using only From-To controls, in order to define the most precise time interval.
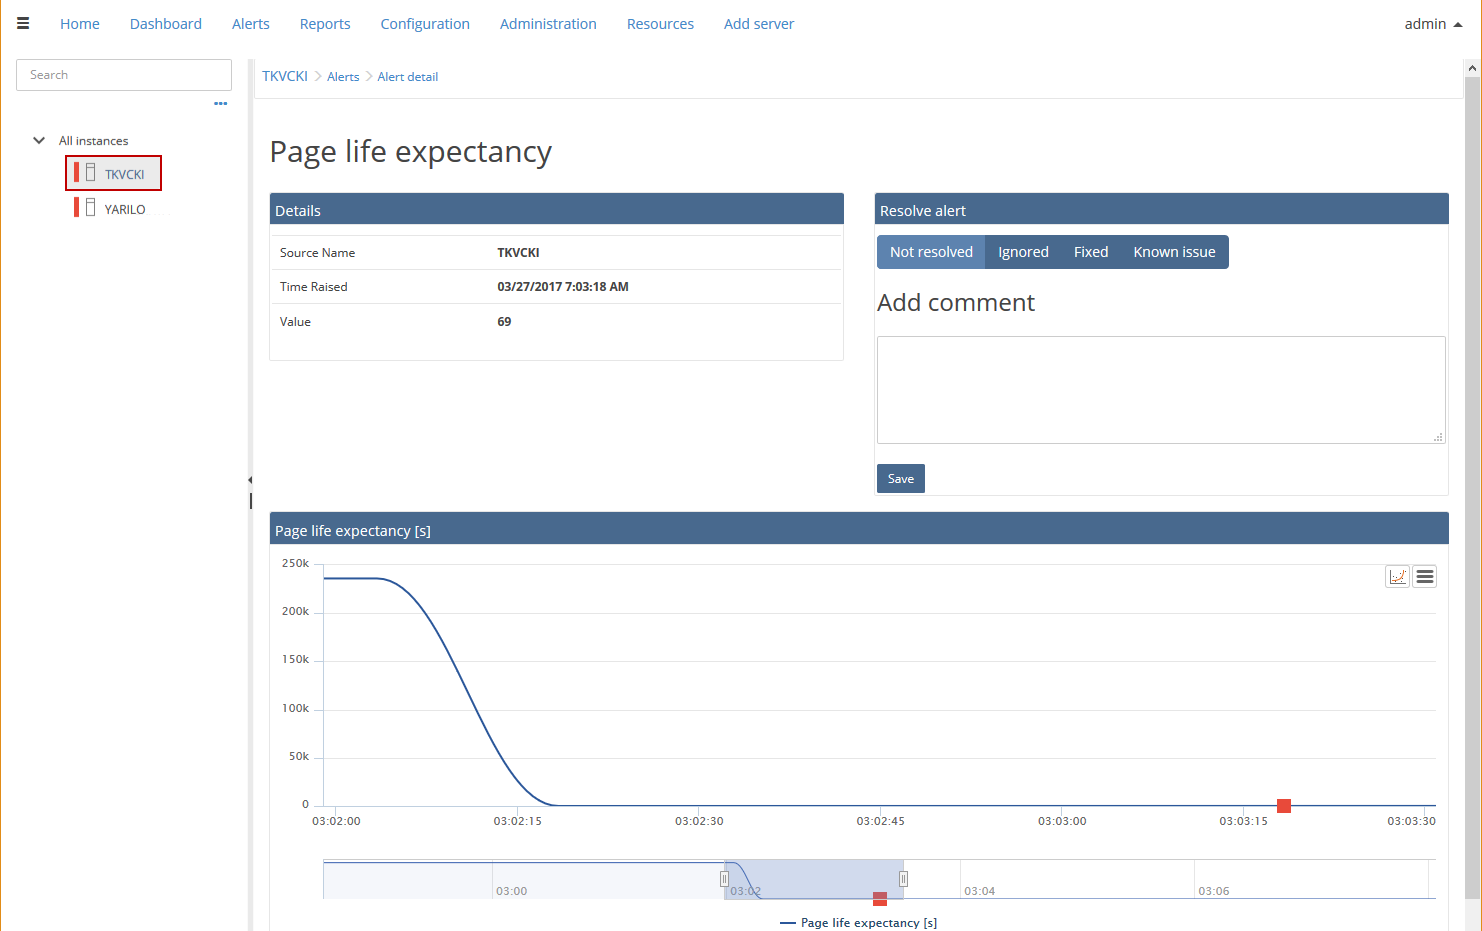
When a particular metric is selected in the alerts list, a chart of metric shows (in this case Page life expectancy), like in the picture above,
along with the alert icon on the curve, placed on exact moment when alert triggered.
Resolving alerts
To resolve alert, one by one, select of the three states (Ignored, fixed or known), in Resolve alert dock, within Alert detail view:
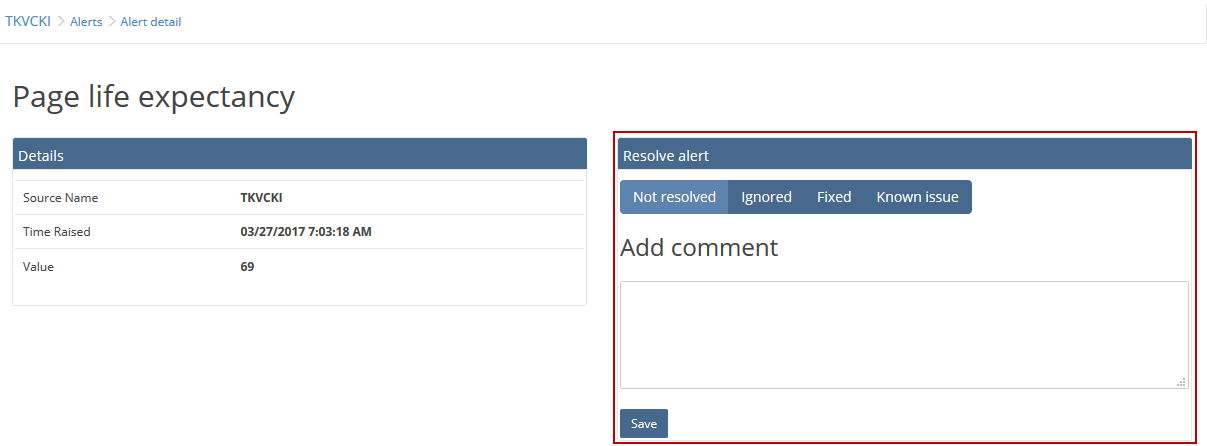
When the alert has been reviewed, comments applied and the state set, click Save.
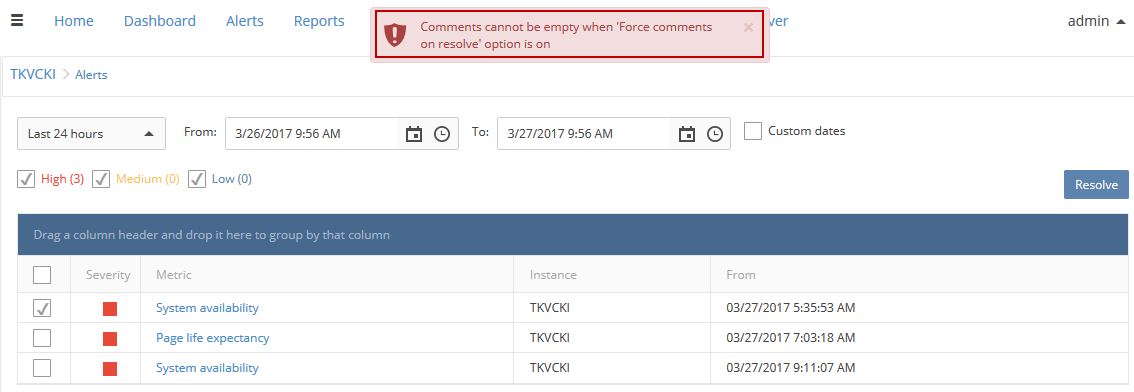
To resolve a group of alerts, select desired alerts and click Resolve button, as shown below:
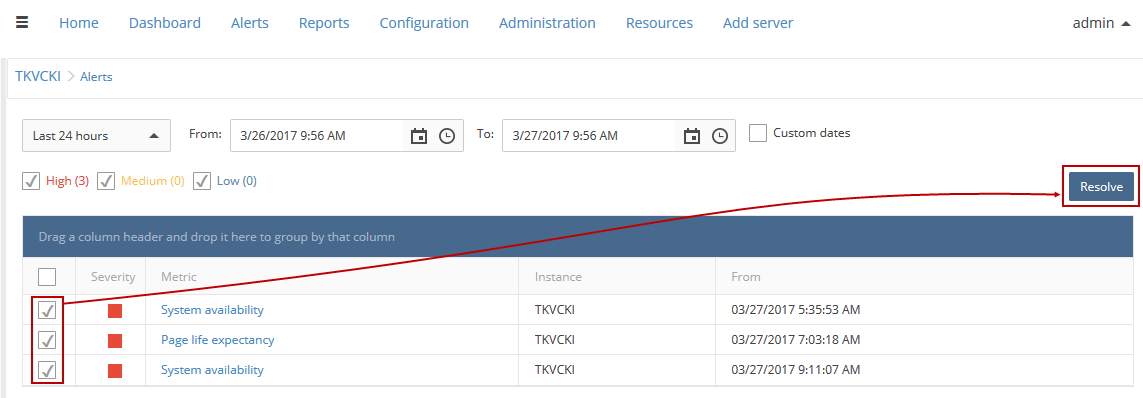
Once an alert or group of alerts is reviewed and saved, they will be considered as resolved, and no longer appear in the active alerts list.
Additional resolving options
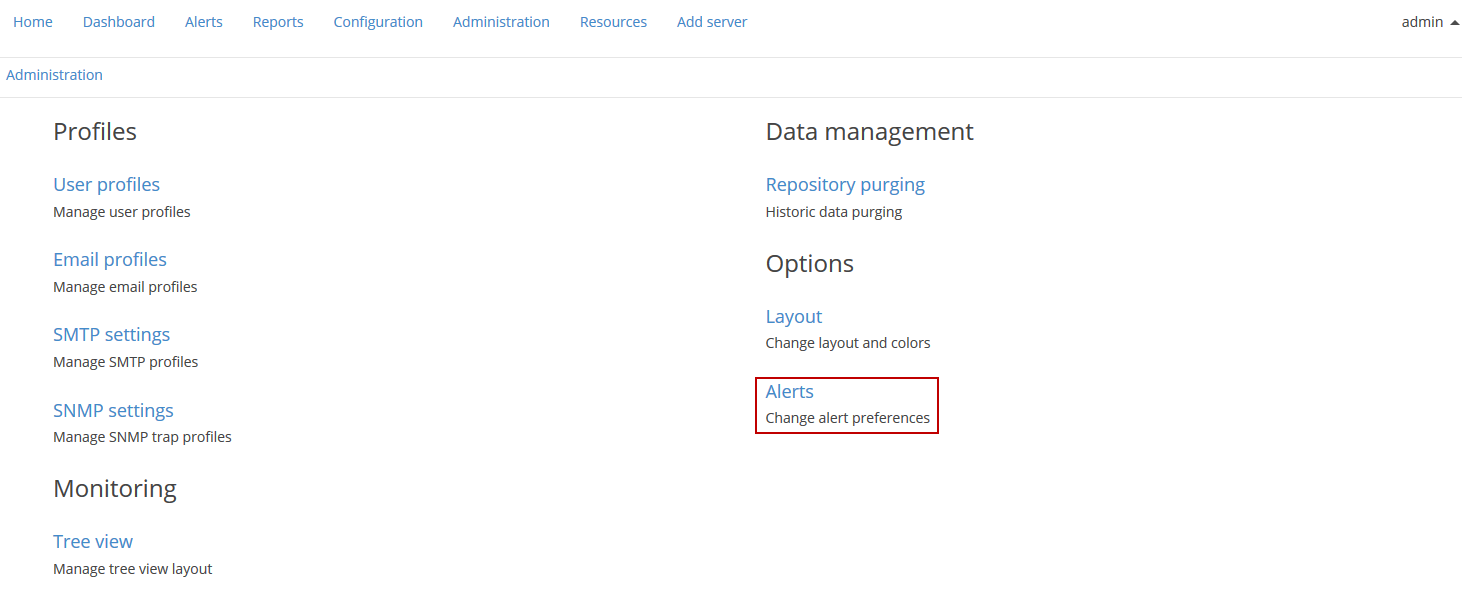
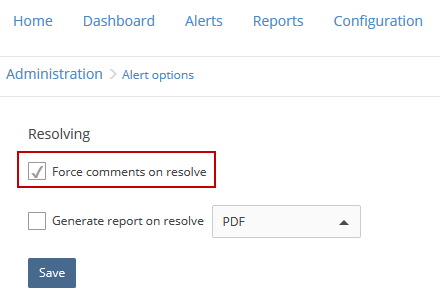
There are two additional options which are related to resolving alerts: Force comments on resolve and Generate report on resolve options. They can be applied from the Alerts tab, Options category, in the Administration subsystem:
When checked, the Force comments on resolve option prevents alerts from being resolved without first applying comments. Use this option to require details, context and other additional information related to the event that has caused the alert.
The Force comments on resolve is a part of default set of options in ApexSQL Monitor, and comments are required when resolving alerts. If the comment field remains empty while resolving alerts, ApexSQL Monitor will display an error message:
Revision of resolved alerts
To review already resolved alerts, go to the Reports subsystem in ApexSQL Monitor, and choose the Resolved alerts tab:
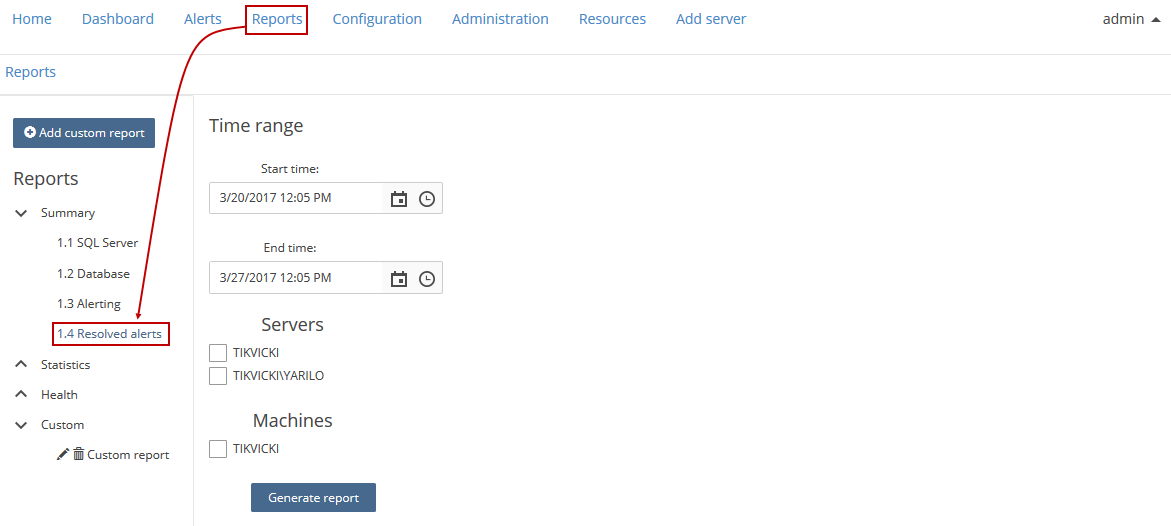
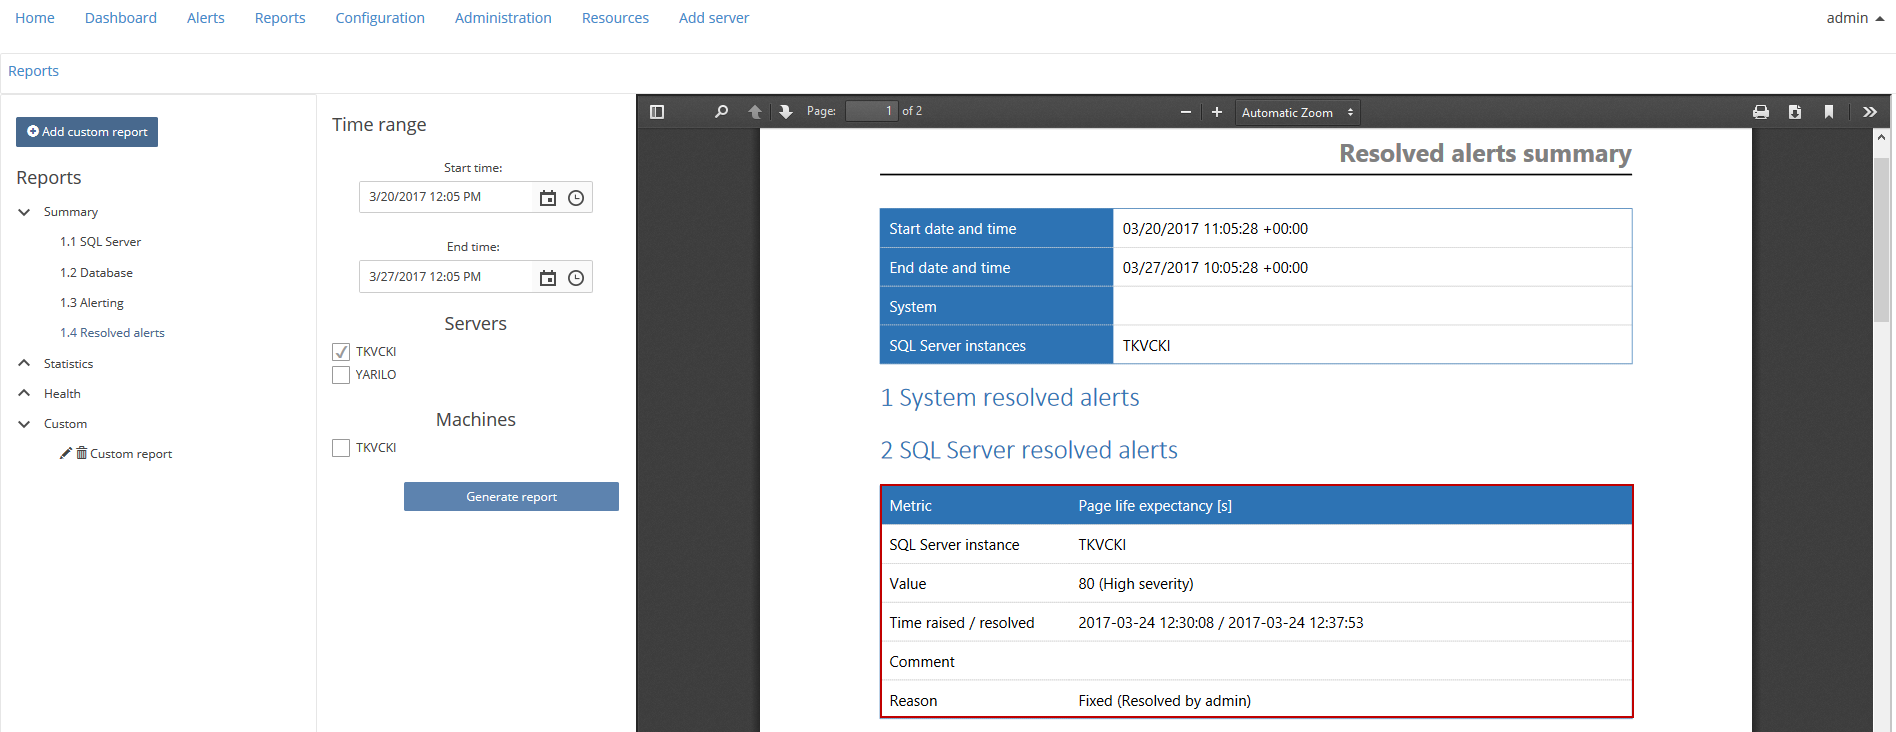
The user can customize the date range, generate the preview of a report for analysis, and generate the actual report on resolved alerts in PDF, XLS or MHTML (Web Archive) formats.
FAQs
Q: Which user level is required e.g. Admin, Reader etc. to resolve alerts?
A: An Admin or Power user role is required to resolve alerts, but Reader level users can only add comments
Q: It is possible to automatically generate documentation on resolved alerts?
A: With ApexSQL Monitor, it is possible to automatically create reports consisting of resolved alert records with the Generate report on resolve option. Upon resolving an alert, the documentation will be automatically created.
Q: Where can I find reports that were automatically generated?
A: Generated reports can be found in this path:
c:\Users\<user_name>\Documents\ApexSQL\ApexSQLMonitor


