


Applies to
ApexSQL Monitor
Summary
ApexSQL Monitor uses SQL Server performance reports as an essential feature for analysis of contemporary and historical SQL Server performance data.
ApexSQL Monitor collects and keeps performance data into a repository database for a time frame defined by the retention policy that can be set by the user. The stored data are used for generating built-in or custom performance reports that are part of the application.
Description
- Why and when should I use ApexSQL monitor reports?
- What report types does ApexSQL Monitor offer?
- What ApexSQL Monitor user permissions do I need for generating performance reports?
- How can I access ApexSQL Monitor performance reports?
- What time period can I use for generating performance reports?
- How does the retention policy affect the performance reports?
- Can I generate a report for multiple sources at once (SQL Servers, databases, etc.)?
- Can I see some additional details directly in the generated report?
- Can I save or email the report for later analysis or archiving purposes?
- How can I schedule the emailing of reports?
- Can I edit already scheduled reports?
- What if I remove some monitored servers that are added in the report scheduler?
Why and when should I use ApexSQL Monitor performance reports?
ApexSQL Monitor reports are designed to provide instant and fast insight into the collected historical performance data using an analytical or summary approach. That facilitates not only in identifying the causes of the SQL Server performance issues but also in understanding the reasoning behind those issues as well as identifying performance trends to get a complete picture of monitored SQL Servers and its environments
Also, a set of high-level reports could help the management to understand and track the shape of the monitored instances as well as the productivity and efficiency of DBAs in maintaining the monitored SQL Servers
What report types does ApexSQL Monitor offer?
ApexSQL Monitor offers over an extensive list of predefined reports divided into six categories:
- Top 10
Reports that are designed to display the top 10 worst performers using criteria defined by the report - Summary
A single place to get insight into the most critical performance data of the monitored SQL Server instances - Alerts
Set of reports that allow quick insight into the alert statistic and handling - Status
Reports designed to allow fast reviewing of the status of SQL Server and its objects - Time slice comparison
Use performance data comparisons for multiple time ranges to improve understanding of the SQL Server long-term performance - Performance
The set of reports that can be generated from any performance metric as a chart for the period defined by the user
What user permissions do I need for using performance reports?
To generate a performance report the Reader user permission is sufficient.
For creating or editing the report scheduler, the Power user or Administrator permissions are required
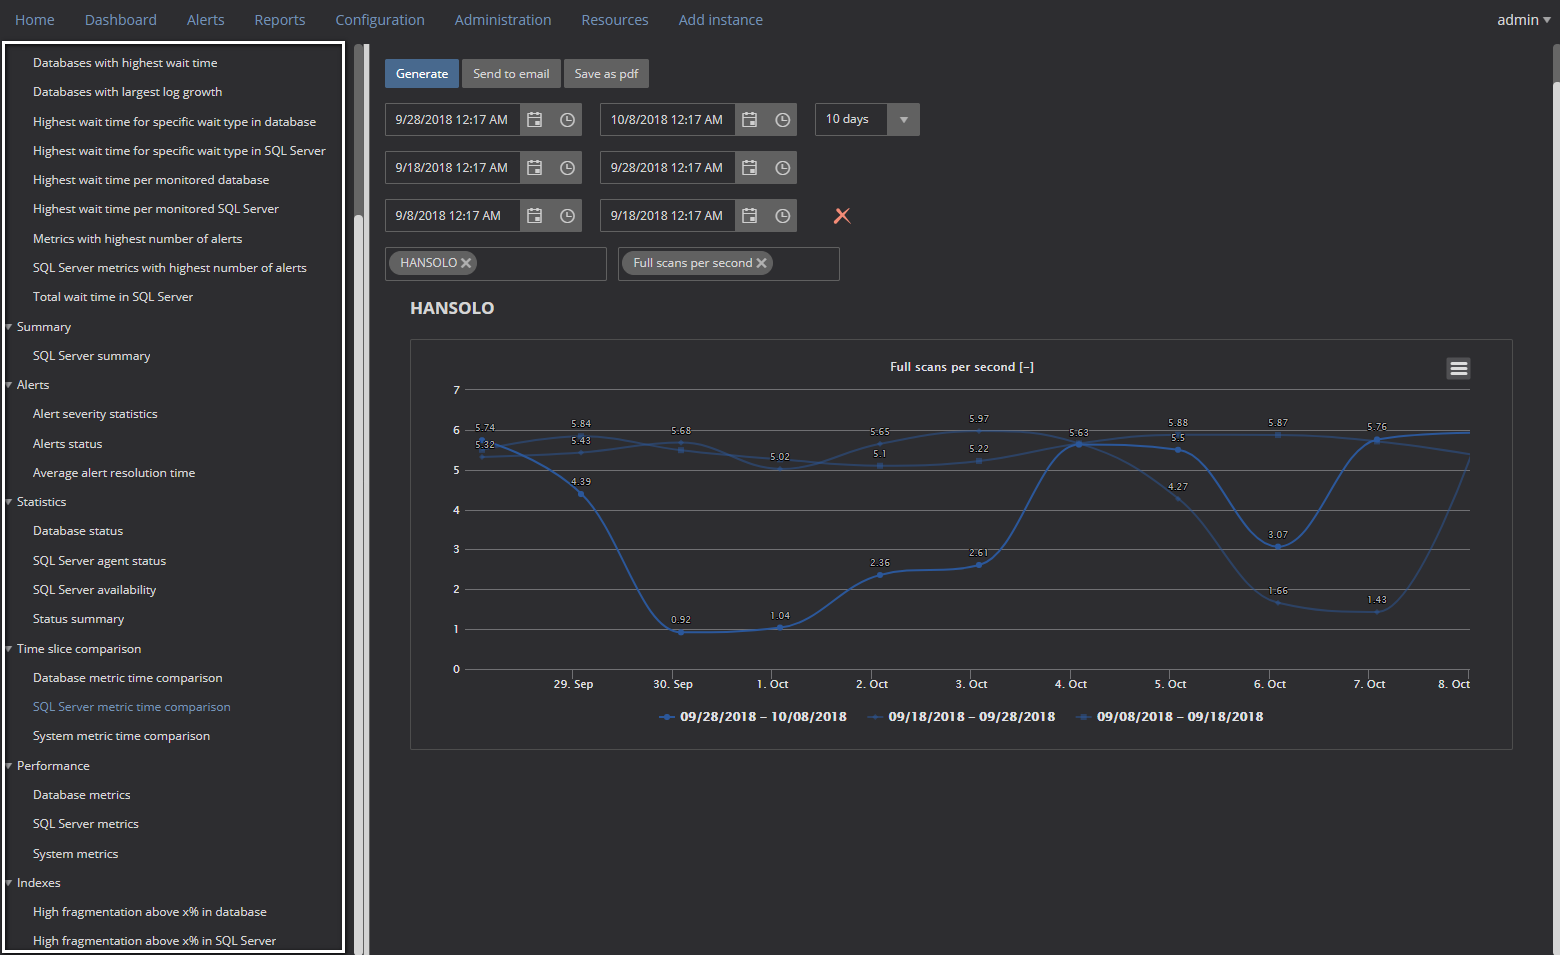
How can I access the performance reports?
To access ApexSQL Monitor reports, click the Reports link in the main menu at the top of the page. The main menu is set as “always on top” so it can be accessed from any page in ApexSQL Monitor
What time period can I use for generating performance reports?
There are four predefined periods that user can select from the drop-down menu: 1 day, 3 days, 7 days and 10 days.
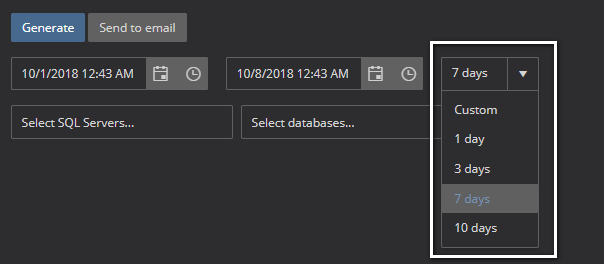
When one of the predefined periods are selected, setting the date and time in one of date/time pickers will automatically set another one to accommodate the selected period
Selecting the Custom period from the drop-down menu allows the full freedom in choosing the From and To date and time to define the reporting period
How does the retention policy affect the performance reports?
All ApexSQL Monitor reports are based on the historical performance data collected and stored in the central repository database. Thus, the reports can be generated only for the data that still exists in the repository database. For example, if the retention policy is set to preserve the data in the last 30 days, the performance reports can be generated only for the last 30 days period as all data older than 30 days will be automatically purged by the application.
The retention policy is closely related to the performance reports period that can be displayed. Therefore, when setting the data retention policy, it is important to take into account the reporting requirements and to adjust the data retention policy to meet the reporting requirements
Can I generate a report for multiple sources at once (SQL Servers, databases, etc.)?
Yes. The reporting module does not impose any restrictions on how many sources can be select for the report.
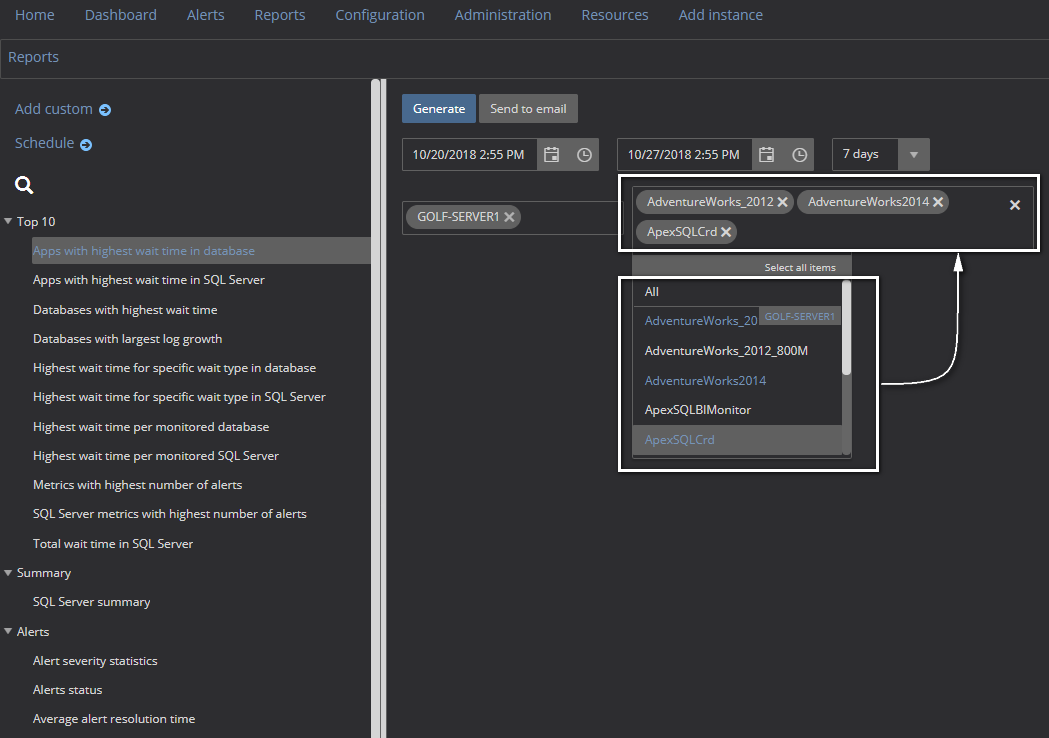
In the above example, multiple databases are selected just by clicking on the names of the database in the drop-down list. The resulting report will be generated for each database specified
Can I see some additional details directly in the generated report?
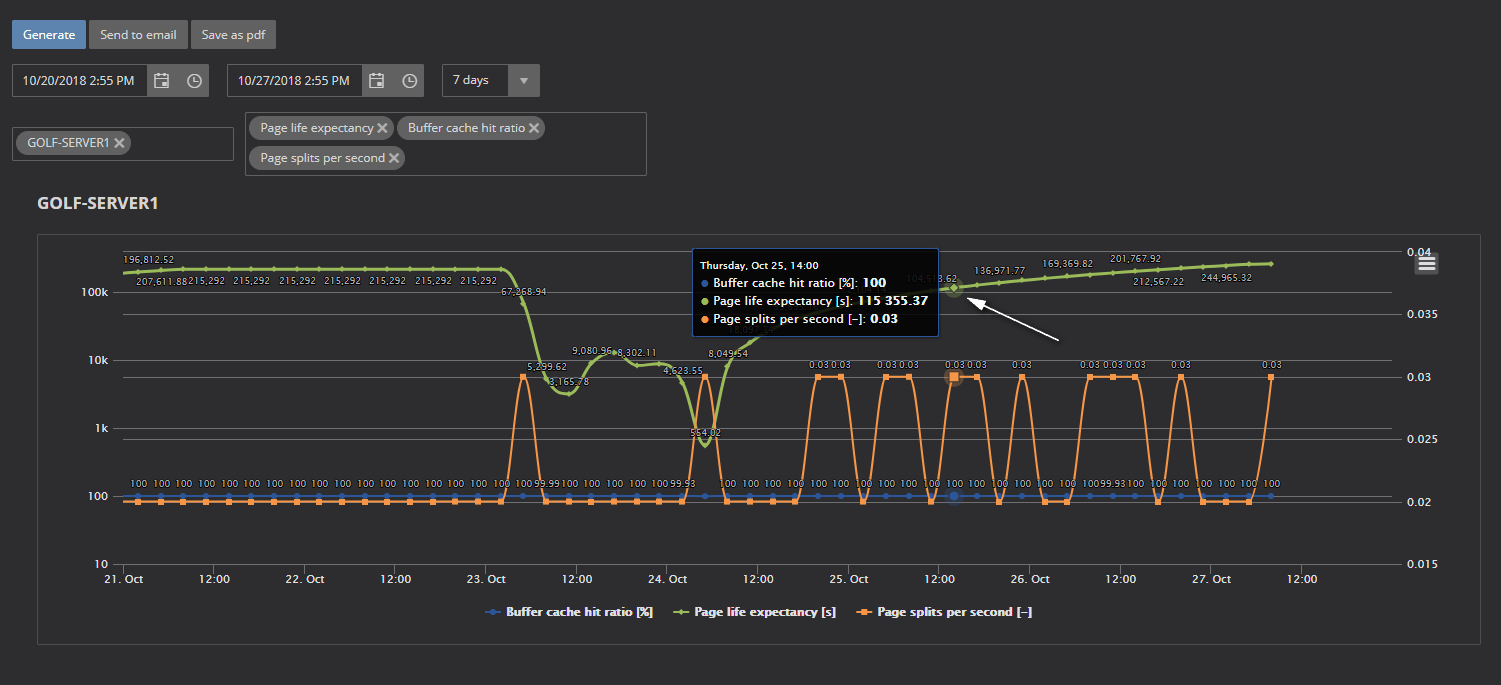
Yes. In all charts, additional details are displayed in the tooltips when hovering over the specific data mark in the chart. In the example below, the specific data values for all metrics included in the chart are displayed. Note that those tooltips will not be included in the report saved as the pdf file or sent as the email.
Can I save or email the report for later analysis or archiving purposes?
Yes. Once the report is generated, it can be saved as a file using the pdf file format and/or sent as an email to any email address
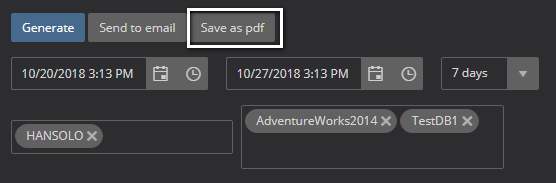
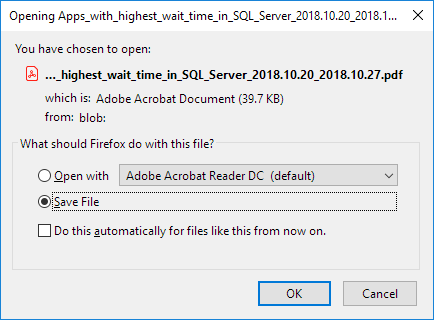
To save the generated report, use the Save as pdf button.
The save of the report to a pdf file will be done using the standard Save As dialog of the used browser (in the example below Mozilla Firefox is used)
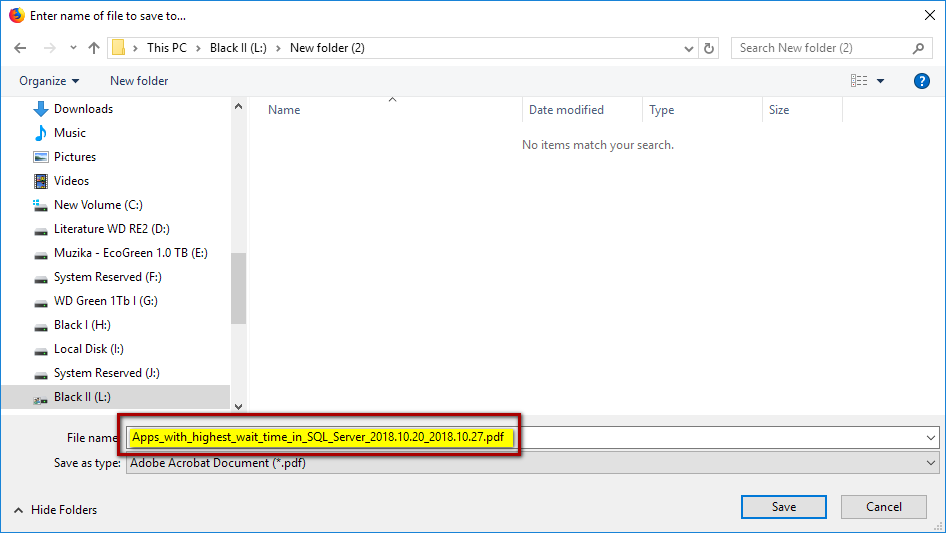
The Report name generates automatically and consists of the name of the generated report and the period for which the report is generated using the following form:
<ReportName>_<FromDate>_<ToDate>
The name can be amended to meet some specific naming rules or according to the personal naming affinities
To send the report to an email address, use the Send to email button
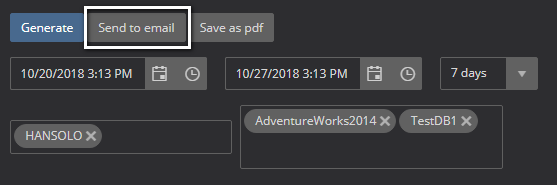
Once the button is pressed, the Email report dialog will be displayed
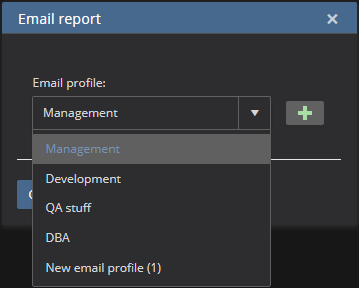
Select the predefined email profile that should be used for sending the report and press the OK button. The email will be sent, and if the sending went OK, the Success would be displayed at the top of the page
Note that ApexSQL Monitor has to be configured to send emails. See Working with email notifications and email profiles in ApexSQL Monitor article for more information.
How can I schedule the emailing of reports?
ApexSQL Monitor lets you create a schedule to send existing reports via email. When scheduled, each scheduled report will be sent as a PDF file attachment. The PDF report send using the scheduler fully resembles the PDF report saved or sent using the ApexSQL Monitor Reports page
To schedule reports, use the Schedule link in the Reports page
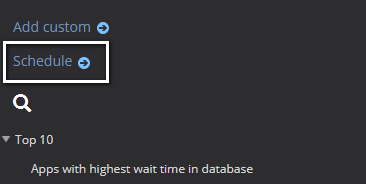
That will open the Schedule reports page
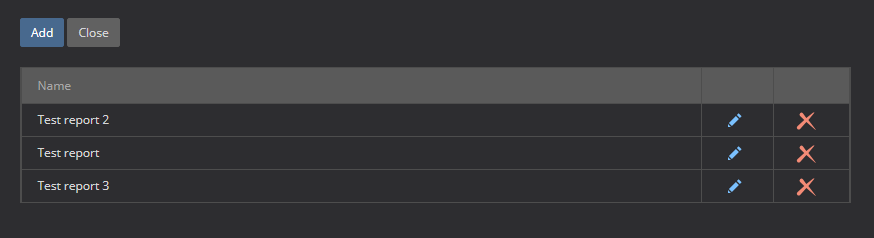
To create a new report scheduler, click on the Add button.
Note: when scheduling reports for the first time, the link will open the Add report schedule page directly
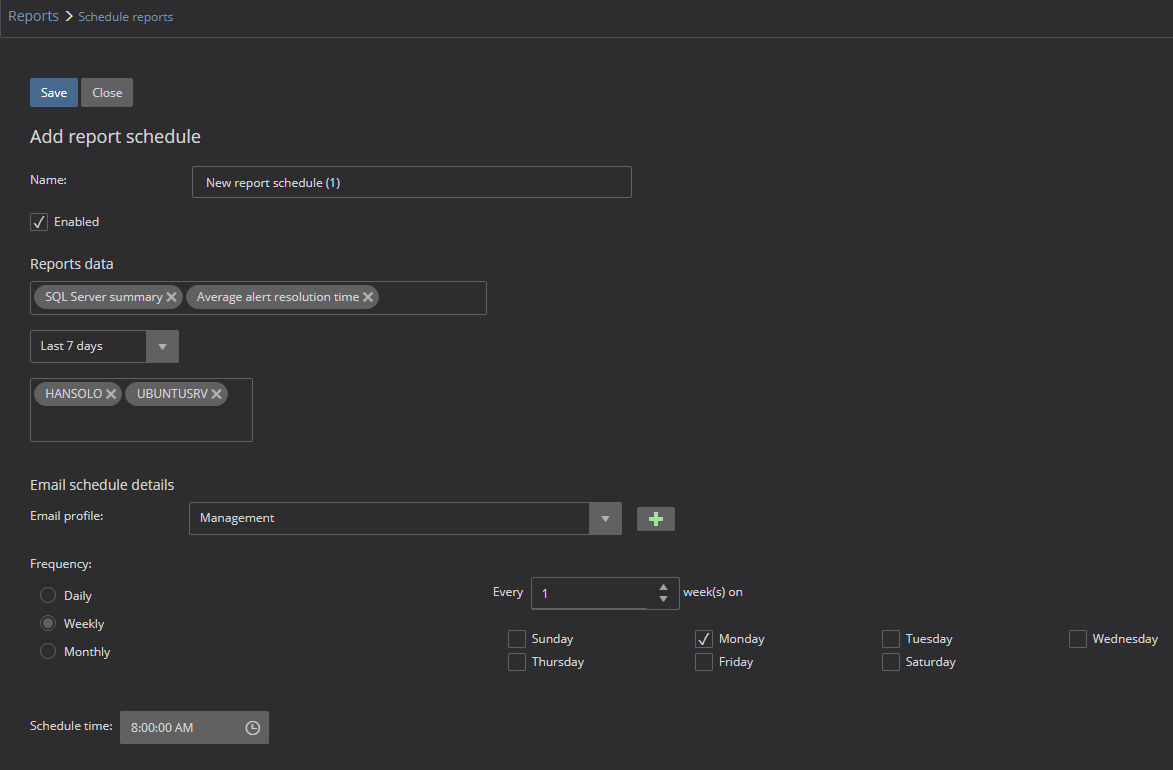
The Add report schedule section follows the standard scheduler scheme that can be seen in the most Microsoft products including the SSMS among others, so only the application-specific options will be explained in more details.
The application-specific parameters that have to be set in the scheduler are:
- Name – Set the name of the scheduler. It is recommended to use the name that resembles the content of the report
- Reports data: Select the reports that will be scheduled. The section is using the drop-down menu with all available reports listed. More than one reports can be added here
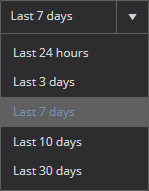
- Report period selector – Select the period for which the reports will be generated. Available options are 24 hours, as well as 3, 7, 10, and 30 days. The period will be calculated using the Scheduled time defined by the user
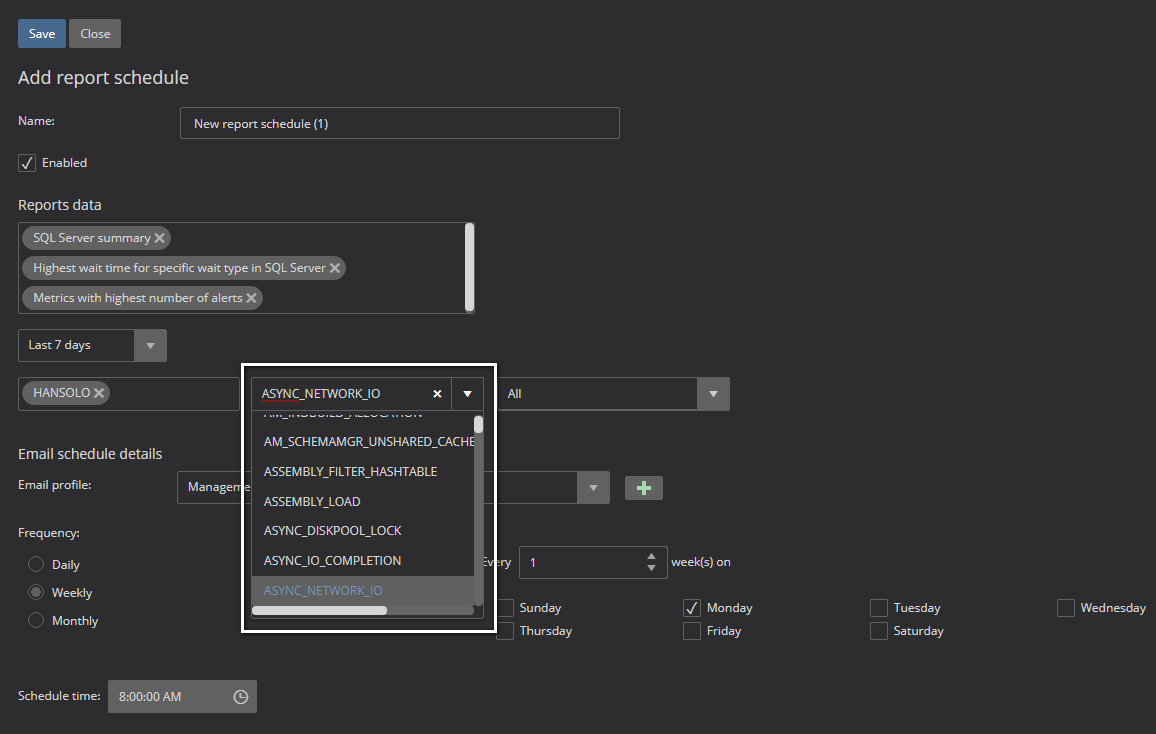
Report data selection – This is the dynamic section that will allow you to select the specific report parameters depending on the reports selected for scheduling.
In the examples below, besides selecting the SQL Server as the standard parameter for reports, additional two reports are added where each requires its parameters for reporting
The Highest wait time for specific wait type in SQL Server report requires the input of the wait type for which the report will be created
At the same time, Metrics with the highest number of alerts report require the input of the alert severity for which the report will be created
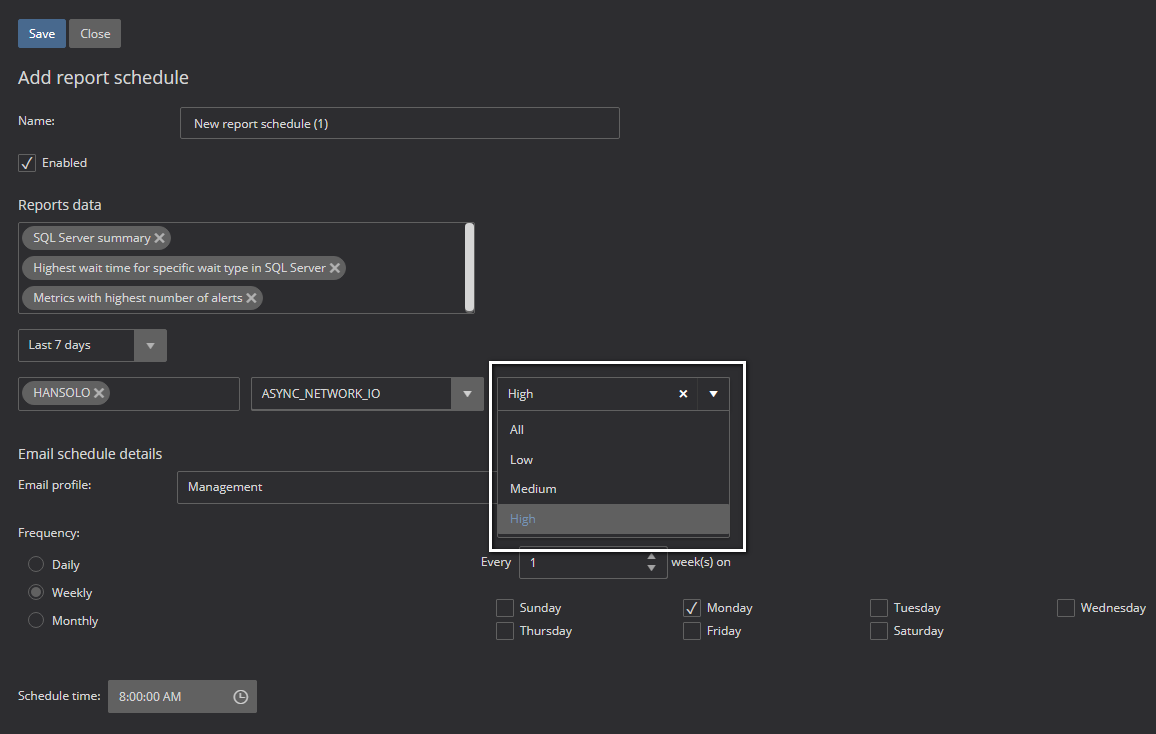
As stated, this is the dynamic section that directly depends on the reports selected for scheduling and requires all the parameters necessary for the selected reports generation, in the same manner, it is required for generating the reports manually
Schedule time – Set the time when the report generation and sending of the generated report will be executed
Once the schedule is configured, press the Save button
Can I edit already scheduled reports?
Yes. Click the pen button for the scheduler that you want to modify
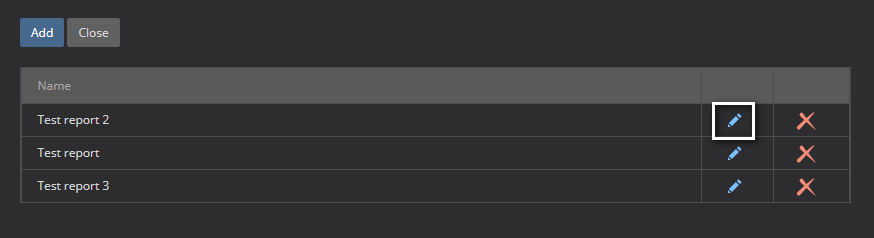
Now edit and save the scheduler in the same way as explained for creating the new report scheduler
What if I remove some monitored servers that were added in the report scheduler?
ApexSQL Monitor will remove any such instance automatically from all schedulers where it exists, so no user actions are required when removing the instance from monitoring


